
Fig. 4
- ID
- ZDB-FIG-251003-34
- Publication
- Lemée et al., 2025 - Disrupted transcriptional networks regulated by CHD1L during neurodevelopment underlie the mirrored neuroanatomical and growth phenotypes of the 1q21.1 copy number variant
- Other Figures
- All Figure Page
- Back to All Figure Page
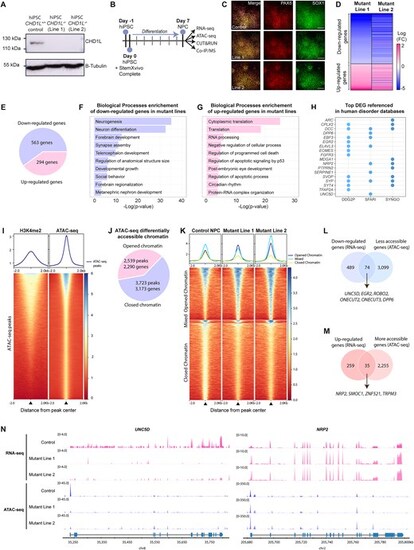
Loss of CHD1L perturbs expression and chromatin accessibility of neurogenesis-associated genes in hNPC. (A) Western blot analysis of CHD1L protein level in control hiPSC CHD1L+/+ and in the two isogenic CHD1L−/− cell lines generated by CRISPR-Cas9 editing showing the absence of CHD1L protein in mutant lines. (B) Schematic representation of human neural progenitor cells (hNPC) generation from hiPSC and subsequent analysis pipeline. (C) Immunostainings of hiPSC-derived hNPC with PAX6 and SOX1 neural progenitor markers. Scale bars: 100 μm. (D) Heatmap of the DEGs in hNPC Mutant Line 1 compared to Mutant Line 2 showing similar expression profiles between both mutants. (E) Pie chart of DEGs in CHD1L−/− hNPC compared to control hNPC (FDR < 0.05). (F, G) Gene Ontology Biological Processes enrichment of the downregulated and upregulated genes in mutant hNPC, respectively. (H) Dot plot of referenced genes in indicated databases associated with human disorders and synaptogenesis function among the 52 most DEG (|log2FC|> 1; FDR < 0.05) in CHD1L mutant hNPC. (I) Average tag density profiles and corresponding heatmap representation of tag density map of H3K4me2 CUT&RUN peaks, ± 2 kb from peak center of ATAC-seq peaks from control hNPC. (J) Pie chart of differentially accessible chromatin sites in CHD1L−/− mutant hNPC (Line 1 and Line 2 combined) compared to control hNPC. (K) Tag density map of control, Mutant Line 1 and Mutant Line 2; ± 2 kb from peak center for 3723 less accessible and 2539 more accessible peaks in CHD1L−/− hNPC and corresponding average tag density profiles. Line 1 and Line 2 were combined and the same direction of change for both mutants was selected; Mixed refers to peaks that exhibit opposite changes in Mutant Line 1 compared to Mutant Line 2 and were discarded from the subsequent analyses. (L) Venn diagram showing 74 downregulated genes that are also less accessible in absence of CHD1L. (M) Venn diagram showing 35 upregulated genes that are also more accessible in absence of CHD1L. (N) Chromatin accessibility and level of expression for UNC5D and NRP2 in control and mutant hNPC. |