
Fig. 3
- ID
- ZDB-FIG-250925-3
- Publication
- Olaya et al., 2025 - Distinct cellular and reproductive consequences of meiotic chromosome synapsis defects in syce2 and sycp1 mutant zebrafish
- Other Figures
- All Figure Page
- Back to All Figure Page
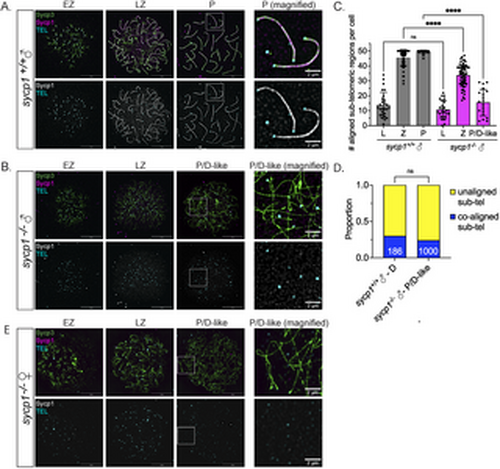
Formation and loss of co-alignment in sycp1-/- spermatocytes. (A) Surface-spread chromosomes from sycp1-/- spermatocytes imaged using structured illumination microscopy stained for Sycp3 (green), Sycp1 (magenta and gray) and telomeres (cyan). Examples of spread chromosomes during meiotic prophase I are shown: EZ (early zygotene), LZ (late zygotene), P (pachytene). Scale bar = 10 µm. Boxed region represents magnified examples of pachytene chromosomes. Scale bar for magnified examples = 2 µm. (B) Surface-spread chromosomes from sycp1-/- spermatocytes as described in (A); P/D (pachytene/diplotene-like). Scale bar = 10 µm. Boxed region represents magnified examples of P/D-like chromosomes. Scale bar for magnified examples = 2 µm. (C) Number of co-aligned pairs of sub-telomeric regions per cell across prophase I in sycp1+/+ and sycp1-/- spermatocytes from (A–B). Images for leptotene (L) are not shown but are characterized by predominantly short un-aligned axes. n = 27, sycp1+/+– L; n = 25, sycp1-/-– L; n, = 61 sycp1+/+– Z; n = 60, sycp1-/-– Z; n = 36, sycp1+/+– P; n = 20, sycp1-/-– P/D-like. Significance was determined using ordinary one-way ANOVA testing with Šidák’s multiple comparisons test. ns = not significant; **** = p < 0.0001. (D) Proportion of co-aligned and unaligned pairs of sub-telomeric regions in sycp1+/+ diplotene (D) (n = 186) and sycp1-/- P/D-like (n = 1000) spermatocytes. 11 cells were used for sycp1+/+ and 20 cells for sycp1-/-. Significance was determined using Fisher’s exact test. ns = not significant. (E) Surface-spread chromosomes from sycp1-/- oocytes as described in (A and B). Scale bar = 10 µm. Boxed region represents magnified examples of P/D-like chromosomes. Scale bar for magnified examples = 2 µm. |