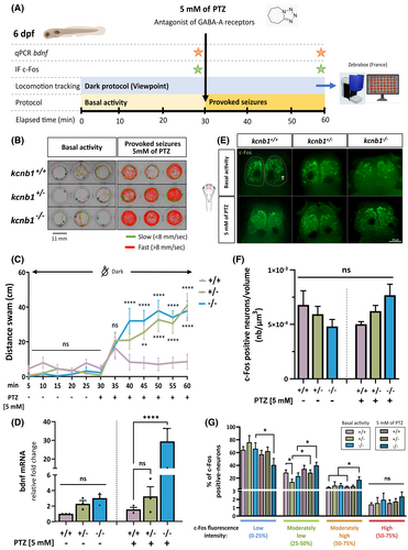
kcnb1 knockout zebrafish exhibit increased locomotor sensitivity to pentylenetetrazol (PTZ) associated with an increased expression of epileptogenesis-related genes. (A) Schematic representation of the protocol followed to identify the impact of the proconvulsant PTZ on locomotion, and bdnf and c-Fos expression. To test the seizure susceptibility in the kcnb1 knockout model, we recorded the baseline locomotor activity of 6 days post-fertilization (dpf) larvae for 30 min, followed by a 30-min exposure to 5 mmol·L−1 PTZ (Zebrabox, ViewPoint Life Sciences). We quantified the expression of two epileptogenesis-related genes at the end of each basal and provoked-seizure periods: bdnf (brain-derived neurotrophic factor) by quantitative polymerase chain reaction (qPCR) and c-Fos by immunohistochemistry (IF). GABA, γ-aminobutyric acid. (B) Schematic representation of individual trajectory of three zebrafish larvae per genotype obtained with ViewPoint software (Zebrabox). Fast swimming circles were observed for both mutant larvae conditions (kcnb1+/− and kcnb1−/−) after 30 min of 5mmol·L−1 PTZ treatment. Green lines: slow movements (<8 mm/s); red lines: fast movements (>8 mm/s). (C) Global locomotor activity of 6-dpf zebrafish in the dark was recorded by applying a protocol of 30 min of basal activity followed by 30 min of chemically induced seizures using PTZ treatment at 5 mmol·L−1. Both kcnb1+/− and kcnb1−/− larvae showed a significant increase in distance traveled during the 30-min recording after the chemical treatment as compared to kcnb1+/+ zebrafish (N = 3; n = 27/genotype; one-way analysis of variance [ANOVA] with Bonferroni post hoc test; +/− and −/− vs. +/+ after PTZ treatment: **p < .01; ****p < .0001). (D) Reverse transcription qPCR analysis of total bdnf mRNA at 6 dpf, an epileptogenesis-related gene, before and after 5mmol·L−1 PTZ treatment (N = 3; n = 30/sample; one-way ANOVA with Bonferroni post hoc test; ****p < .0001). Data are normalized to ef1α mRNA expression, and kcnb1+/+ nontreated larvae are considered as the reference value (relative fold change = 1). The kcnb1−/− condition presents a tendency toward an increased bdnf transcript expression during the basal locomotor activity, which is confirmed by a significantly increased expression after chemically induced-seizures as compared to kcnb1+/+ and kcnb1+/−. (E) Whole-mount images of 6-dpf zebrafish immunostained with anti-c-Fos, an immediate–early neuronal and epileptogenesis-related gene, obtained 30 min after basal activity and 5mmol·L−1 PTZ treatment periods. The telencephalon (T) was the major region activated after the chemical treatment for each genotype (n = 8–11/condition, dorsal view, three-dimensional reconstruction, scale bar = 50 μm, magnification = 20×). (F) Quantification of the number of c-Fos-positive neurons (nb) normalized to the volume (μm3) of the telencephalon of 6-dpf larvae during their basal or chemically treated periods using IMARIS v10.1.0 software (Oxford Instruments; see Figure S3A). The results did not show any difference in the number of activated neurons in both knockout conditions (kcnb1+/− and kcnb1−/−) as compared to the kcnb1+/+ condition in pre- and post-PTZ treatment periods (n = 8–11/condition; Mann–Whitney test). (G) Distribution (as a percentage) of c-Fos-positive neurons according to the fluorescence intensity value of c-Fos in the telencephalon of zebrafish at 6 dpf, reflecting the level of neural activation that was divided into four equal shares (from 0% to 100%): low (0%–25%), moderately low (25%–50%), moderately high (50%–75%), and high (75%–100%) neural activation. The three nontreated conditions presented a similar distribution, with a majority of low neuronal activation of c-Fos positive neurons. However, the chemically treated kcnb1−/− zebrafish presented higher global activation, with a significant shift to moderately low and moderately high neuronal activation (see Figure S3B). n = 8–11/condition; Mann–Whitney test; *p < .05. ns, non-significant.
|
