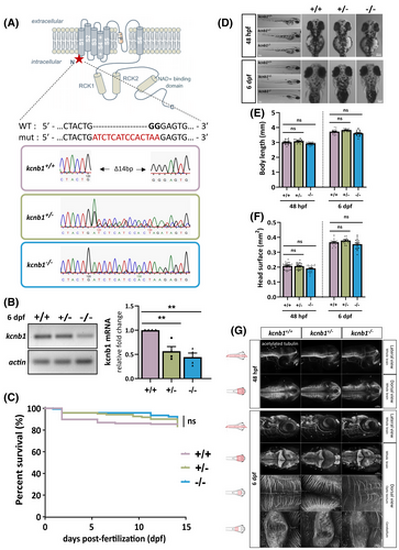
Genotypic characterization of a kcnb1 knockout (KO) zebrafish model without brain anatomical defects. (A) Schematic illustration of the generation of a kcnb1 KO zebrafish model obtained by Shen et al.40 The representation of the α-subunit kcnb1 is adapted from a previous schematic picture.44 Using the CRISPR-Cas9 (Clustered Regularly Interspaced Short Palindromic Repeats) system, the kcnb1 KO zebrafish model was generated by the insertion of a 14-bp nucleotide sequence (indicated in red) and of a 2-bp nucleotide deletion (indicated in black bold type) in the first exon of the gene, resulting in the introduction of a premature stop codon (∆14 bp), and localized between the N-terminal region and the first transmembrane domain of the protein (targeted sequence: GGAGCTGGACTACTGGGGAG in kcnb1 exon 1; ID zfin: ZDB-ALT-170417-2; indel mutation; line: kcnb1sq301/sq301). (B) Reverse transcription quantitative polymerase chain reaction analysis of total kcnb1 at 6 days post fertilization (dpf) demonstrating a significant decrease of kcnb1 mRNA in kcnb1+/− and kcnb1−/− compared with wild-type (WT; kcnb1+/+) larvae (N = 4; n = 30/sample; one-way analysis of variance [ANOVA] with Bonferroni post hoc test; **p < .01). Data are normalized to actin mRNA expression, and the condition kcnb1+/+ is considered as the reference value (relative fold change = 1). (C) Kaplan–Meier survival curve between 0 and 15 dpf showing that the loss of kcnb1 does not impact the normal growth of fish at early stages of development (see Table S1; N = 3; n = 121–169/genotype; log-rank test). (D) Images showing that kcnb1+/− and kcnb1−/− zebrafish do not show gross morphological changes at 48 hours post-fertilization (hpf) and 6 dpf (scale bar = 300 μm). (E, F) Quantification of major morphological aspects at 48 hpf and 6 dpf including measurement of (E) body length and (F) head surface. kcnb1 KO models (kcnb1+/− and kcnb1−/−) do not show any significant change in each parameter at different developmental stages as compared to kcnb1+/+ (N = 4; n = 28–38/genotype; one-way ANOVA with Bonferroni post hoc test). (G) Whole-mount images of embryonic (48 hpf) and larvae (6 dpf) zebrafish immunostained with anti-acetylated tubulin marker to identify global circuits of neuronal fibers (lateral and dorsal view; three-dimensional reconstruction; magnification = 20× with scale bar at 100 μm; magnification = 40× with scale bar at 20 μm). The loss of kcnb1 does not affect the neuronal brain density at different early stages of development (n = 5–7/genotype/developmental stage). ns, non-significant.
|
