
Fig. 4
- ID
- ZDB-FIG-250526-32
- Publication
- Huang et al., 2025 - Agouti and BMP signaling drive a naturally occurring fate conversion of melanophores to leucophores in zebrafish
- Other Figures
- All Figure Page
- Back to All Figure Page
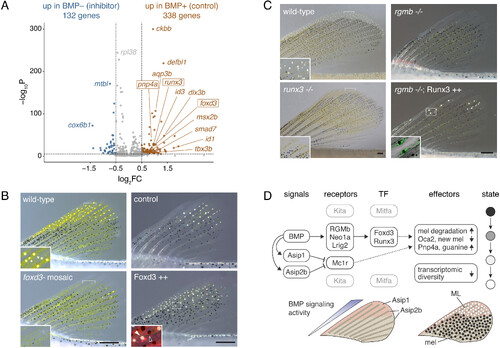
BMP-dependent genes in ML development. (A) Differential gene expression in melanophore–ML isolated from acutely inhibitor treated (BMP-) or DMSO-control (BMP+) early juvenile fish. Dotted lines, log2FC>|0.5 |, q < 0.05. (B) Fish mosaic for somatic mutations in foxd3 had fewer ML, whereas heat-shock induced Foxd3-2a-nuc-mCherry led to significantly more ML. Insets, details (Left) and fluorescence overlay (Right) with nuclear mCherry in binucleated Foxd3++ ML (white arrowhead) and melanophore (black arrowhead). (C) runx3 mutants were viable, had normal fins, and lacked nearly all ML (means ± SE ML, WT: 144 ± 7; runx3: 5 ± 8 ML; F1,14 = 163.6, P < 0.0001). Insets, details (Left) and overlay showing cytosolic EGFP in ML, with guanine deposits black in this pseudobrightfield image. (D) Upper, Model for major contributors to melanophore–ML conversion. Dark, addressed in this study. Gray, addressed in (10). “BMP” refers to pathway signaling activity overall, as inferred by pSmad immunostaining (SI Appendix, Fig. S3B), likely to involve ligand Gdf6a (SI Appendix, Fig. S9D) and possibly other differentially distributed factors (SI Appendix, Fig. S9A). Dashed lines indicate potential regulatory linkages. Lower, Inferred regions exposed to higher levels of signaling factors during fin outgrowth. ML differentiate where BMP signaling and Agouti gene expression are strongest. Additional key figures: BMP→Asip1 (SI Appendix, Fig. S11B); BMP→Asip2b (SI Appendix, Figs. S11B and S12D); BMP→RGMb/Neo1a/Lrig2 (Fig. 3 D–H); Asip1, Asip2b gene expression (Fig. 2 A and C and SI Appendix, Figs. S7 C and E and S11B); BMP→→Foxd3 & Runx3→→transitional (Fig. 4 A–C and SI Appendix, Fig. S12G); melanin / melanosome degradation and cellular remodeling (Fig. 1D and SI Appendix, Figs. S1B and S5); Oca2, melanin & Pnp4a, guanine (Fig. 1 I and J and SI Appendix, Figs. S1E and S3 A and C); transcriptomic diversity (Fig. 1J and SI Appendix, Fig. S4 G and F). (Scale bars, B and C 200 µm). |