
- Title
-
Agouti and BMP signaling drive a naturally occurring fate conversion of melanophores to leucophores in zebrafish
- Authors
- Huang, D., Kapadia, E.H., Liang, Y., Shriver, L.P., Dai, S., Patti, G.J., Humbel, B.M., Laudet, V., Parichy, D.M.
- Source
- Full text @ Proc. Natl. Acad. Sci. USA
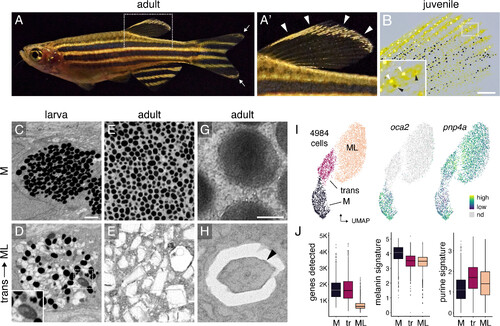
Melanoleucophore (ML) ornamentation and characteristics. (A and A′) ML occur along anterior and distal edges of the dorsal fin (arrowheads, A′) and in lesser numbers at the tips of the caudal fin (arrow, A). (B) Juvenile fish with white ML (white arrowheads, Inset) and gray transitional cells (black arrowheads). Pigmentary organelles have been contracted toward cell centers by epinephrine treatment; yellow pigments are contained within xanthophores. A second class of leucophore, xantholeucophores, occurs only in the anal fin (9) and these cells are not included in the present analyses. (C and D) In late larvae, melanophores (M) contain rounded melanosomes whereas transitional cells have heterogeneous pigmentary organelles including irregular or enlarged melanosomes (Inset). (E and F) In adults, melanophores contain rounded melanosomes whereas ML contain jagged leucosomes with crystalline contents. (G and H) Melanosome and leucosome with crystal (arrowhead). C–F, pigmentary organelles contracted to cell centers by epinephrine treatment, with imaging by focused ion beam scanning electron microscopy (FIB–SEM); G and H, transmission EM. (I) Single-cell transcriptomes in UMAP space with cell states (Left) and transcript abundances for melanogenesis gene oca2 and purine salvage gene pnp4a (Right). (J) Compared to melanophores, ML had fewer genes detected, fewer transcripts of genes for melanogenesis, and more transcripts of genes for purine synthesis. Boxplots, medians, and interquartile ranges. (Scale bars, B 200 µm, 8C for C–F 1 µm, G for G and H 0.2 µm.) |
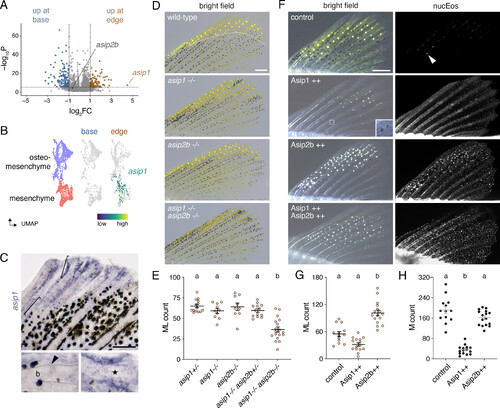
Agouti genes contribute to ML development. (A) Among cells in the melanophore–ML environment (dermis, osteoblasts, osteomesenchyme, epidermis, neurons, glia; n = 3172 cells) asip1 was expressed 4.5-fold higher in the fin edge than base (P = 2.4E-8, q = 0.0004). Transcripts for a second Agouti gene, asip2b, were present, but not differentially abundant. The plane along which fins were dissected into edge vs. base for scRNA-Seq is indicated by the dashed line in D (Top). (B and C) asip1 transcripts were limited to mesenchyme and osteomesenchyme in edge (UMAP and cell type colors subsets of SI Appendix, Fig. S7A). Brackets in C correspond to details. Arrowhead, joint between proximal fin bones (b; lepidotrichia). asip1 transcripts were most abundant in cells adjacent to distal developing lepidotrichia (star). (D and E) Fish mutant for asip1 or asip2b developed normal numbers of ML type. By contrast, fish doubly mutant for both loci had significantly fewer ML than WT siblings. Overall ANOVA, F4,56 = 18.9, P < 0.0001. Shared letters above groups indicate means not significantly different (P > 0.05) by post hoc Tukey–Kramer HSD. (F–H) Asip1 overexpression led to fewer ML, and melanophores, whereas Asip2b overexpression resulted in more ML, without significantly affecting melanophore numbers. Inset for Asip1++ shows two lightly melanized melanophores. In qualitative results from fish that expressed both Asip1 and Asip2b, ML often developed widely across fins nearly devoid of melanophores. nucEos, widespread expression of nuclear localizing Eos, linked by 2A sequence to Asip1 or Asip2b in hsp70l-driven transgenes. Arrowhead, reflecting ML guanine crystals in nontransgenic control. Overall ANOVAs, G,H: F2,41 = 46.2, 84.6, P < 0.0001. Bars in E, G, and H, means ± SE. (Scale bars, C 100 µm, D and F 200 µm.) |
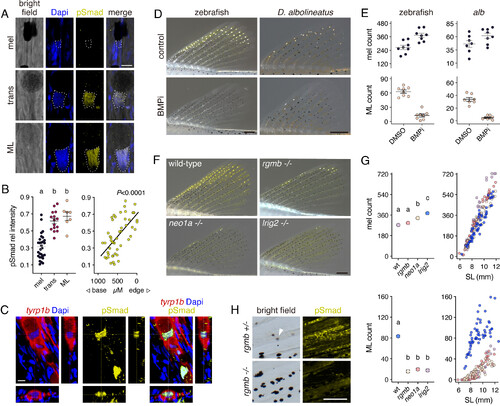
BMP-dependent melanophore–ML transition involves rgmb-neo1a-lrig2. (A) pSmad immunoreactivity was prominent in nuclei (outlined) of transitional cells and ML. (B) Intensities of pSmad staining relative to Dapi across cell states (Left) and locations (measured as distance from the most distal ML; R2 = 0.39). Shared letters indicate means not significantly different in Tukey–Kramer post hoc comparisons (overall F2,48= 35.15, P < 0.0001). (C) ML expressing membrane-targeted tyrp1b:PALM-mCherry, illustrating pSmad immunoreactivity in Dapi-labeled nucleus. (D and E) BMP signaling inhibitor (BMPi) led to zebrafish and D. albolineatus having marginally greater numbers of melanophores (F1,14 = 16.59, P < 0.005 and F1,13 = 3.58, P = 0.08, respectively) and fewer ML (F1,14 = 98.59, P < 0.0001 and F1,13 = 113.83, P < 0.0001). (F) Mutants for premature termination alleles of rgmb, neo1a, and lrig2 had more melanophores and were severely deficient for ML. (G) Melanophores (Upper) and ML (Lower) across genotypes. Left plots show least square means (±SE) after controlling for variation in standard length (SL), a proxy for stage of development (41). Shared letters indicate means not significantly different in post hoc comparisons after controlling for SL and genotype x SL interactions (all factors in ANOVAs, P < 0.0001; numbers of ML square-root transformed to control for increased variance in residuals with larger counts). Fin lengths for a given SL did not differ among genotypes (SI Appendix, Fig. S8G). (H) rgmb mutants exhibited markedly reduced anti-pSmad immunoreactivity across the fin. Arrowhead, transitional cell (in transmitted illumination). (Scale bars, D 200 µM for zebrafish and D. albolineatus, F 200 µm, H 100 µm.) |
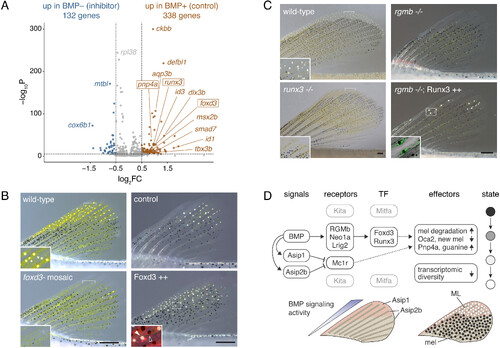
BMP-dependent genes in ML development. (A) Differential gene expression in melanophore–ML isolated from acutely inhibitor treated (BMP-) or DMSO-control (BMP+) early juvenile fish. Dotted lines, log2FC>|0.5 |, q < 0.05. (B) Fish mosaic for somatic mutations in foxd3 had fewer ML, whereas heat-shock induced Foxd3-2a-nuc-mCherry led to significantly more ML. Insets, details (Left) and fluorescence overlay (Right) with nuclear mCherry in binucleated Foxd3++ ML (white arrowhead) and melanophore (black arrowhead). (C) runx3 mutants were viable, had normal fins, and lacked nearly all ML (means ± SE ML, WT: 144 ± 7; runx3: 5 ± 8 ML; F1,14 = 163.6, P < 0.0001). Insets, details (Left) and overlay showing cytosolic EGFP in ML, with guanine deposits black in this pseudobrightfield image. (D) Upper, Model for major contributors to melanophore–ML conversion. Dark, addressed in this study. Gray, addressed in (10). “BMP” refers to pathway signaling activity overall, as inferred by pSmad immunostaining (SI Appendix, Fig. S3B), likely to involve ligand Gdf6a (SI Appendix, Fig. S9D) and possibly other differentially distributed factors (SI Appendix, Fig. S9A). Dashed lines indicate potential regulatory linkages. Lower, Inferred regions exposed to higher levels of signaling factors during fin outgrowth. ML differentiate where BMP signaling and Agouti gene expression are strongest. Additional key figures: BMP→Asip1 (SI Appendix, Fig. S11B); BMP→Asip2b (SI Appendix, Figs. S11B and S12D); BMP→RGMb/Neo1a/Lrig2 (Fig. 3 D–H); Asip1, Asip2b gene expression (Fig. 2 A and C and SI Appendix, Figs. S7 C and E and S11B); BMP→→Foxd3 & Runx3→→transitional (Fig. 4 A–C and SI Appendix, Fig. S12G); melanin / melanosome degradation and cellular remodeling (Fig. 1D and SI Appendix, Figs. S1B and S5); Oca2, melanin & Pnp4a, guanine (Fig. 1 I and J and SI Appendix, Figs. S1E and S3 A and C); transcriptomic diversity (Fig. 1J and SI Appendix, Fig. S4 G and F). (Scale bars, B and C 200 µm). |