
Fig. 2
- ID
- ZDB-FIG-250526-30
- Publication
- Huang et al., 2025 - Agouti and BMP signaling drive a naturally occurring fate conversion of melanophores to leucophores in zebrafish
- Other Figures
- All Figure Page
- Back to All Figure Page
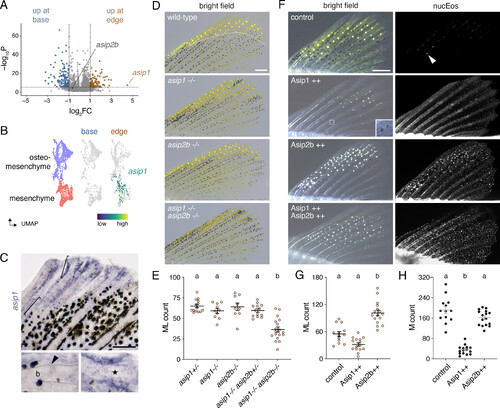
Agouti genes contribute to ML development. (A) Among cells in the melanophore–ML environment (dermis, osteoblasts, osteomesenchyme, epidermis, neurons, glia; n = 3172 cells) asip1 was expressed 4.5-fold higher in the fin edge than base (P = 2.4E-8, q = 0.0004). Transcripts for a second Agouti gene, asip2b, were present, but not differentially abundant. The plane along which fins were dissected into edge vs. base for scRNA-Seq is indicated by the dashed line in D (Top). (B and C) asip1 transcripts were limited to mesenchyme and osteomesenchyme in edge (UMAP and cell type colors subsets of SI Appendix, Fig. S7A). Brackets in C correspond to details. Arrowhead, joint between proximal fin bones (b; lepidotrichia). asip1 transcripts were most abundant in cells adjacent to distal developing lepidotrichia (star). (D and E) Fish mutant for asip1 or asip2b developed normal numbers of ML type. By contrast, fish doubly mutant for both loci had significantly fewer ML than WT siblings. Overall ANOVA, F4,56 = 18.9, P < 0.0001. Shared letters above groups indicate means not significantly different (P > 0.05) by post hoc Tukey–Kramer HSD. (F–H) Asip1 overexpression led to fewer ML, and melanophores, whereas Asip2b overexpression resulted in more ML, without significantly affecting melanophore numbers. Inset for Asip1++ shows two lightly melanized melanophores. In qualitative results from fish that expressed both Asip1 and Asip2b, ML often developed widely across fins nearly devoid of melanophores. nucEos, widespread expression of nuclear localizing Eos, linked by 2A sequence to Asip1 or Asip2b in hsp70l-driven transgenes. Arrowhead, reflecting ML guanine crystals in nontransgenic control. Overall ANOVAs, G,H: F2,41 = 46.2, 84.6, P < 0.0001. Bars in E, G, and H, means ± SE. (Scale bars, C 100 µm, D and F 200 µm.) |