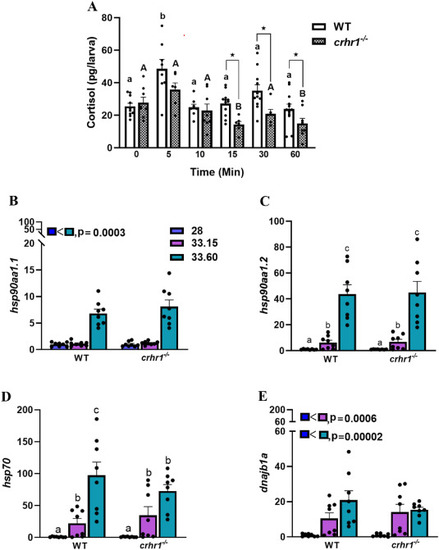
Loss of Crhr1 inhibits TS-induced cortisol response but not heat shock protein response: The top panel shows the whole-body cortisol levels among wildtype and crhr1−/− (A) at 28 °C (0 time-point) and at different time points (5–60 min) post-thermal stressor (33 °C). Bars represent mean + SEM with individual data points shown; bars with different letters (lowercase for WT and uppercase for crhr1−/−; only interaction but no main effect, P = 0.018) are significantly different (nonparametric two-way ANOVA; P = 0.018, n = 6–12, each a pool of 8–12 larvae). Asterisk (∗) represents significant differences between two groups (comparing each time point, P = 0.05). The bottom panel shows the transcript abundance of members of the heat shock protein (hsp) family, including hsp90aa1.1 (B, only main effect, no significant interaction, P = 0.0003), hsp90aa1.2 (C, only interaction, no main effect, P = 0.0006), hsp70.1 (D, only interaction, no main effect, P = 0.0002), and dnaja3b (E, only main effect (28 vs 33.15, P = 0.0006; 28 vs 33.60, P = 00002) and no significant interaction) in the wildtype and crhr1−/− larvae following exposure to 28 °C (28) for 60 min or 33 °C for 15min (33.15) or 60 min (33.60). Bars represent mean + SEM; bars with different letters for each gene are significantly different (nonparametric Two-way ANOVA, n = 8, each a pool of 6–12 larvae). The main effect is shown as an inset (Fig. 1B and E), while bars with different letter denotes significant interactions (between groups).
|
