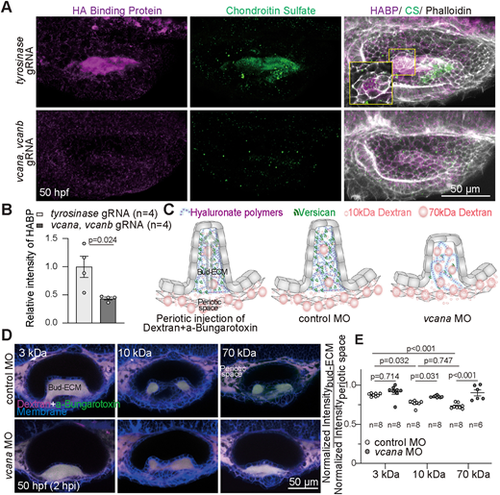
Versican regulates density of the bud-ECM via accumulation of HA. (A,B) 3D-rendered OVs showing hyaluronic acid (HA), chondroitin sulfate (CS), and F-actin using HA-binding protein (HABP), anti-chondroitin sulfate antibody, and phalloidin, respectively, at 50 hpf in embryos injected with tyrosinase or versican double gRNA. Inset shows 2D section of the antero-lateral bud. Scale bar: 50 μm. (B) Quantification of fluorescence intensity of HABP in embryos injected with tyrosinase or versican double gRNA. Maximum intensity projection images (20 μm-thickness) of HABP in the lateral bud region were used for the quantification. Data are mean±s.e.m. n denotes the number of embryos measured from two independent experiments. P-values as labeled (unpaired, two-tailed Student's t-test). (C) Illustration showing the different sizes of dextran injected into the periotic region percolating into the bud-ECM region in control and vcana knockdown conditions. (D) Composite of 2D sections of OVs showing percolation of dextran from periotic region into the bud-ECM region at 2 h post-injection (hpi). Different sizes of Texas-Red dextran, 3 kDa, 10 kDa, or 70 kDa (magenta), with approximate Stokes radii 1, 2, or 5 nm, respectively, were co-injected with aBt (green) in membrane-NeonGreen (blue)-expressing control or vcana MO-injected embryos. aBt colocalizes with all three dextran sizes in the periotic region (white). Contrast is the same across embryos. Scale bar: 50 μm. (E) Quantification of fluorescence intensities of different sizes of dextran in the bud-ECM region normalized to their intensities in the periotic space. Data are mean±s.e.m. n denotes the number of embryos measured from two independent experiments. P-values as labeled (one-way ANOVA with Tukey's test). Representative images from two independent experiments are shown.
|
