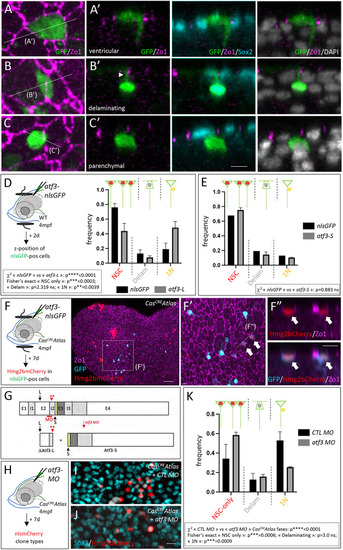
Atf3 can drive NSC delamination and is needed for the CasCREAtlas fate bias. (A-E) Cell fates expressed by adult pallial ventricular cells at 2 days post-electroporation (dpe). (A-C′) Visual categorization of the three possible fates in whole-mount pallia with IHC for GFP (green, electroporated construct), ZO1 (magenta) and Sox2 (cyan), and counterstaining with DAPI (gray). A-C: Dorsal (apical) views; A′-C′: Cross-sections as indicated in A-C. Arrowhead in B′ indicates apical attachment of a delaminating cell. (D,E) Experimental scheme and quantification of cell fate categories upon electroporation of atf3-L-P2A-nlsGFP versus nlsGFP (D) and atf3-S-P2A-nlsGFP versus nlsGFP (E). Graphs display mean±s.e.m. (D) nlsGFP n=214 cells, atf3-L-P2A-nlsGFP n=69 cells, from 4 and 3 hemipallia, respectively. Statistical analysis for global differences between nlsGFP and atf3-L fates: contingency χ2 test: ****P<0.0001; statistical analyses for individual fates among the three observed possible fates [NSCs (NSC singlets and doublets), single delaminating cells, and single neurons (1N)]: Fisher's exact test with Bonferroni correction: NSC ***P<0.0003; delaminating: P=2.319; neurons only: **P=0.0039. (E) nlsGFP n=62 cells, atf3-S-P2A-nlsGFP n=121 cells, from 2 and 3 hemipallia, respectively. Statistical analysis for global differences between nlsGFP and atf3-S fates: contingency χ2 test: P=0.883. (F-F″) Some NSCs overexpressing Atf3-F in CasCREAtlas double-transgenic adults are also Hmg2bmCherrypos at 7 dpe. IHC for Zo1 (magenta), GFP (cyan, electroporated construct) and Hmg2bmCherry (red) in whole-mount pallium. F′ shows high magnification of the boxed area in F (dorsal views, anterior left); F″ shows magnified cross-section as indicated in F′. White arrows indicate double-positive cells. (G) Exon-intron structure of atf3 (top) and predicted proteins (bottom) produced upon splice blockade by atf3-MO (red bar). E1-E4, exons; I1-I3, introns. Black arrows and arrowhead indicate ATG for Atf3-L (L) and Atf3-S (S), respectively; red arrowhead with double asterisk indicates double stop codon in I2. Color code as in Fig. 4E. (H-K) Atf3-L function blockade in CasCREAtlas. (H) Experimental scheme. (I,J) IHC for Hmg2bmCherry (red) and Sox2 (cyan) in whole-mount CasCREAtlas pallia 7 days after injection of the control MO (CTL MO; I) or atf3-MO (J) (dorsal views). (K) Quantification of the three observed CasCreAtlas clone types: ‘NSC-only’ (single NSCs and NSC doublets), ‘Delam’ (single delaminating cells) and single neurons (‘1N’). Graph displays mean±s.e.m. Statistical analysis for global differences between control MO and atf3 MO: contingency χ2 test: ****P<0.0001; statistical analyses for individual fates among the three observed possible fates: Fisher's exact test with Bonferroni correction: NSC ***P<0.0006; delaminating: P=3.0; 1N: ***P=0.0009. n=6 hemipallia per condition; control MO: n=82 clones; atf3 MO: n=43 clones. ns, not significant. Scale bars: 8 µm (A-C); 50 µm (F,F′); 10 µm (F″); 8 µm (I,J).
|
