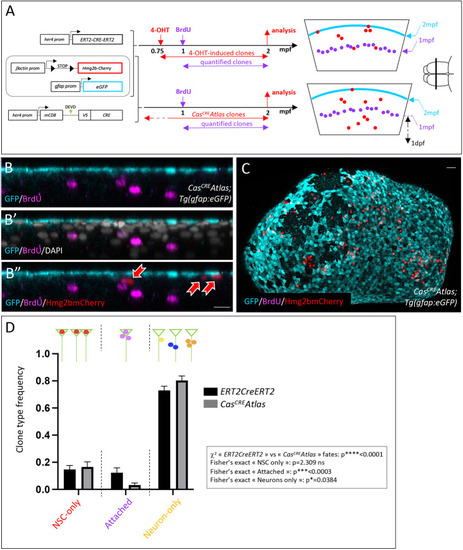
CasCREAtlas clones in pallial NSCs display a biased fate. (A) Tg(her4:ERT2CreERT2);Tg(βact:lox-stop-lox-hmg2bmCherry);Tg(gfap:eGFP) (top) and CasCREAtlas;Tg(gfap:eGFP) (bottom) triple transgenic fish were used to compare NSC fates. Left: Genotypes. Middle: Schematic of the experiment. Right: Schematic cross-sections with relative positions of the NSC layer (cyan), BrdU-labeled neurons (magenta) and Hmg2bmCherry-positive clones (red) in each genotype. Schematic of the brain on the right (anterior left, dorsal view) shows the position of these schematic cross-sections. (B-B″) IHC for GFP (cyan, NSCs), BrdU (magenta) and Hmg2bmCherry (red) in a cross-section of a CasCREAtlas;Tg(gfap:eGFP) fish. Red arrows point to Hmg2bmCherrypos cells. (C) Whole-mount CasCREAtlas;Tg(gfap:eGFP) 2mpf pallium with IHC for GFP, BrdU and Hmg2bmCherry (dorsal view, anterior left). (D) Frequency of the different Hmg2bmCherrypos clone types (green triangles represent NSCs; colored dots represent Hmg2bmCherrypos cells) generated from her4pos NSCs between 1 and 2 mpf in the her4:ERT2CreERT2 and CasCREAtlas backgrounds (black and gray bars, respectively) (n=5 brains for each; her4:ERT2CreERT2 tracing: 344 clones; CasCREAtlas: 360 clones). Graph displays mean±s.e.m. Statistical analysis for global differences between ERT2CreERT2 and CasCreAtlas fates: contingency χ2 test: ****P<0.0001. Statistical analyses for individual fates among three possible fates [‘NSC only’, ‘attached’, and ‘neurons only’ (one neuron or more)]: Fisher's exact test with Bonferroni correction: NSC only P=2.309; attached: ***P<0.0003; neurons only: *P=0.0384. ns, not significant. Scale bars: 15 µm (B,B′); 30 µm (C).
|
