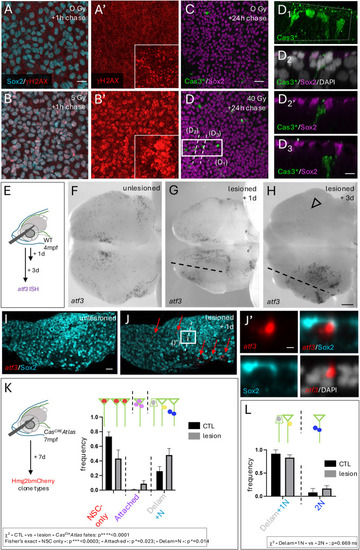
Differential recruitment of atf3pos and Cas3* events under irradiation versus mechanical lesion. (A-D3) Effect of X-rays on NSCs in vivo. (A-B′) γH2AX DNA repair foci (red) in NSCs/NPs (Sox2pos, cyan) revealed by whole-mount IHC on adult pallia under control (A,A′) or irradiation conditions (B,B′) (5 Gy+1 h chase). (C-D3) Casp3* induction (green) in NSCs/NPs (Sox2pos, magenta) revealed by whole-mount IHC on adult pallia under control (C) or irradiation conditions (D) (40 Gy+24 h chase). D1 shows high magnification 3D rendering (Imaris) of the boxed area in D; D2, D2′ and D3 show sections across Cas3* cells as indicated in D. (E-L) Effect of mechanical lesion. (E-J′) atf3 expression detected by chromogenic ISH (F-H: black; I-J′: red) on whole-mount pallia 1 day (G,I,J) or 3 days (H) following stab-wound injury (E) versus uninjured brains (F,I). Dorsal views, anterior left; one hemisphere is shown in I,J. Dashed lines indicate lesion trajectories; open arrowhead indicates downregulated atf3 expression in the contralateral hemisphere at 3 dpl. (J′) High magnification section across an atf3pos cell along the dashed line in J. (K) Proportion of CasCREAtlas clone types in control versus lesioned hemispheres at 7 dpl. Graph displays mean±s.e.m. Statistical analysis for global differences between CasCREAtlas clone types between lesioned and unlesioned hemispheres: contingency χ2 test: ****P<0.0001; statistical analyses for individual fates among three possible fates [NSCs (NSC singlets and doublets), attached clones, and neurogenic clones (delaminating cells, 1N or 2N; this category contains >70% 1N clones in both cases)]: Fisher's exact test with Bonferroni correction: NSC ***P<0.0003; attached: *P=0.023; Delam+N: *P=0.014. Control: 8 hemipallia, n=84 clones; Lesion: 7 hemipallia, 79 clones. (L) Proportion of neurogenic CasCREAtlas clone types in control versus lesioned hemispheres at 7 dpl, distinguishing single versus double neurons. Graph displays mean±s.e.m. Statistical analysis for global differences between single versus double neurons: contingency χ2 test: P=0.669. CTL, control; ns, not significant. Scale bars: 10 µm (A,A′,B,B′); 20 µm (C-C′); 10 µm (D1-D3); 100 µm (F-H); 30 µm (I,J); 10 µm (J′).
|
