|
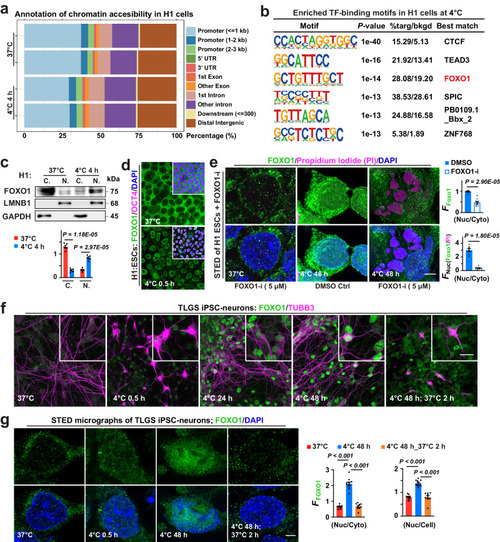
FOXO1 and cell cold adaptation. a Stacked bar plots showing genomic annotation of chromatin accessible regions in different groups. b Binding motifs of transcription factors (TF) enriched in H1 cells following 4-h incubation at 4 °C. c Up: Immunoblots of FOXO1 proteins in cytosolic (C.) and nuclear (N.) fractions, conditions annotated; down: FOXO1 protein levels (n = 5 experiments). d Confocal images of FOXO1, pluripotency marker OCT4 and nuclear DNA (DAPI) staining in human embryonic stem cells (H1 ESCs) at indicated conditions (n = 10 experiments). e Left: Stimulated emission depletion (STED) micrographs detailing FOXO1, Propidium Iodide (PI; to stain dead cells) and DAPI signals in H1 cells at indicated conditions; right: Nuc FFOXO1 versus Cyto FFOXO1, or versus FPI (n = 7 and 8 experiments for DMSO and FOXO1-i, respectively); FOXO1-i, FOXO1 inhibitor. f Confocal images of FOXO1 and neuronal marker TUBB3 in TLGS iPSC-derived neurons at indicated conditions. g Left: STED images showing FOXO1 proteins and nuclear DNA (DAPI-stained) in TLGS iPSC-neurons at indicated conditions; right: the mean intensity of FOXO1 fluorescence (FFOXO1) in the nucleus (Nuc) versus that in the whole cell (Cell) or the cytosol (Cyto) was analyzed (from left to right, n = 10, 10, 9 images from 5 experiments). Data are shown as mean and SEM. Statistics: two-tailed Student’s t test (c, e) and one-way ANOVA followed by Tukey’s test (g). Scale bars: 20 μm (d, f) and 2.5 μm (e, g). Source data are provided as a Source Data file.
|