IMAGE

Fig. 1

ID
ZDB-IMAGE-240405-46
Source
Figures for Zhang et al., 2024
Image
Figure Caption

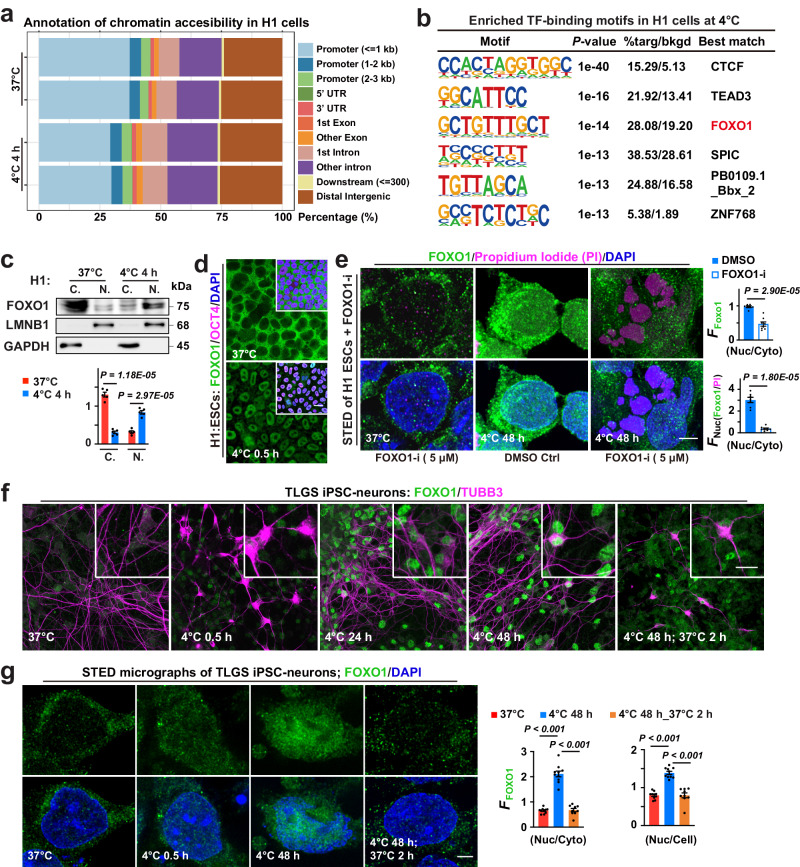
Fig. 1 FOXO1 and cell cold adaptation.

a Stacked bar plots showing genomic annotation of chromatin accessible regions in different groups. b Binding motifs of transcription factors (TF) enriched in H1 cells following 4-h incubation at 4 °C. c Up: Immunoblots of FOXO1 proteins in cytosolic (C.) and nuclear (N.) fractions, conditions annotated; down: FOXO1 protein levels (n = 5 experiments). d Confocal images of FOXO1, pluripotency marker OCT4 and nuclear DNA (DAPI) staining in human embryonic stem cells (H1 ESCs) at indicated conditions (n = 10 experiments). e Left: Stimulated emission depletion (STED) micrographs detailing FOXO1, Propidium Iodide (PI; to stain dead cells) and DAPI signals in H1 cells at indicated conditions; right: Nuc FFOXO1 versus Cyto FFOXO1, or versus FPI (n = 7 and 8 experiments for DMSO and FOXO1-i, respectively); FOXO1-i, FOXO1 inhibitor. f Confocal images of FOXO1 and neuronal marker TUBB3 in TLGS iPSC-derived neurons at indicated conditions. g Left: STED images showing FOXO1 proteins and nuclear DNA (DAPI-stained) in TLGS iPSC-neurons at indicated conditions; right: the mean intensity of FOXO1 fluorescence (FFOXO1) in the nucleus (Nuc) versus that in the whole cell (Cell) or the cytosol (Cyto) was analyzed (from left to right, n = 10, 10, 9 images from 5 experiments). Data are shown as mean and SEM. Statistics: two-tailed Student’s t test (c, e) and one-way ANOVA followed by Tukey’s test (g). Scale bars: 20 μm (d, f) and 2.5 μm (e, g). Source data are provided as a Source Data file.

Acknowledgments
This image is the copyrighted work of the attributed author or publisher, and ZFIN has permission only to display this image to its users. Additional permissions should be obtained from the applicable author or publisher of the image. Full text @ Nat. Commun.