|
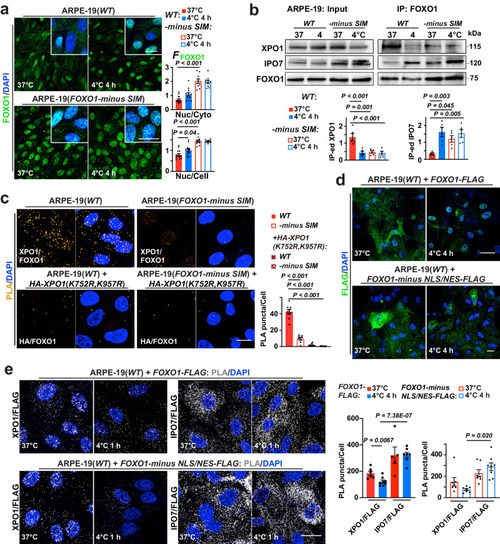
FOXO1 nuclear export determined by FOXO1 SUMO-interacting motif (SIM) and XPO1 SUMOylation a Left: confocal images of FOXO1 and DAPI in ARPE-19(WT) and ARPE-19(FOXO1-minus SIM) at annotated conditions; right: FFOXO1 ratio analyzed (from left to right, n = 14, 12, 10 and 10 images from 5 experiments). b Up: Input and FOXO1 IP-ed fractions from ARPE-19(WT) and ARPE-19(FOXO1-minus SIM) cells at annotated conditions were immunoblotted against XPO1, IPO7 and FOXO1; down: signal intensities normalized (n = 5 experiments). c Left: confocal images of PLA on FOXO1 interaction with endogenous XPO1, or with overexpressed, HA-tagged XPO1 with both SUMOylation sites replaced with an arginine residue (K-R mutation) in ARPE-19(WT) and ARPE-19(FOXO1-minus SIM) cells at 37 °C (from left to right, n = 9, 7, 11 and 11 images from 3 experiments); right: average counts of PLA puncta per cell. d Confocal images of FLAG tag and DAPI staining in ARPE-19(WT) cells overexpressing FLAG-tagged, FOXO1 or mutant FOXO1 deleted of both NLS and NES domains (FOXO1-minus NLS/NES; in-frame deletion of amino acids 245-274 and 371-380) at annotated conditions (n = 3 experiments); NLS, nuclear localization sequence; NES, nuclear export signal. e Left: confocal images of PLA on indicated interacting pairs in ARPE-19(WT) cells overexpressing FLAG-tagged, FOXO1 or FOXO1-minus NLS/NES at annotated conditions; right: average counts of PLA puncta per cell (from left to right, n = 6, 8, 5, 7, 7, 7, 7 and 8 images from 3 experiments). Data are shown as mean and SEM. Statistics: one-way ANOVA followed by Tukey’s test (a−c) and two-tailed Student’s t test (e). Scale bars: 20 μm. Source data are provided as a Source Data file.
|