|
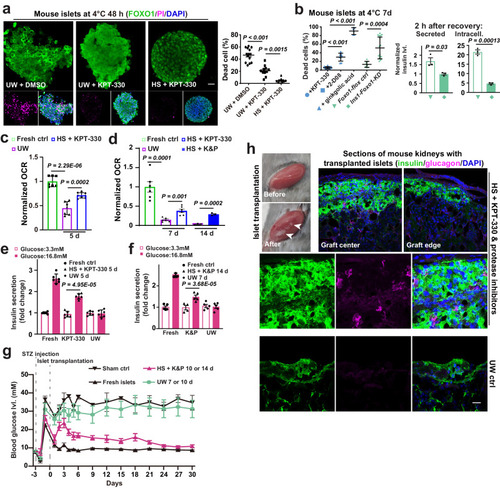
Mouse pancreatic islet long-term storage and transplantation. a Left: confocal images of FOXO1, PI and DAPI staining in mouse islets at indicated conditions; right: statistics on cell death percentage (from left to right, n = 14, 11 and 8 images from 3 experiments); UW, University of Wisconsin Solution; HS, basal hibernation solution used in cell cold exposure experiments. b Left: dead cell percentage in cold-stored mouse islets at annotated conditions (from left to right, n = 14, 9, 6, 8 and 16 images from 3 experiments); 2-D08 and ginkgolic acid are SUMOylation inhibitors added to HS; Ins1-Foxo1-KD, pancreatic β cell-specific knock-down of Foxo1; right: normalized levels of secreted and intracellular insulin in rewarmed islets as indicated (n = 3 experiments). Normalized islet oxygen consumption rate (OCR) from indicated conditions, as an assessment of islet quality following 24-h (fresh and UW: n = 7 experiments; KPT-330: n = 8 experiments) (c) or 2-h (n = 6 and 3 experiments for 7 and 14 d, respectively) (d) rewarming in vitro; K&P, KPT-330 and protease inhibitors. Glucose-stimulated insulin secretion assays with mouse islets from indicated conditions following 24-h (n = 6 experiments) (e) or 2-h (n = 5 experiments) (f) rewarming in vitro. g Blood glucose levels in Streptozotocin (STZ)-treated diabetic mice with cold-stored islets at indicated conditions (mice with sham transplantation: n = 3; transplanted with fresh islets: n = 5; n = 3 each for UW 7 or 10 d; n = 5 and 6 for HS + K&P 10 d and 14 d, respectively). h Representative image showing the transplanted islets (arrowheads), and confocal images of insulin, Glucagon and DAPI staining on kidney sections of the diabetic mice transplanted with islets stored at 4 °C in HS + K&P for 14 days (n = 6 mice), or with islets stored in UW solution at 4 °C for 5 days (n = 3 mice). Data are shown as mean and SEM. Statistics: one-way ANOVA followed by Tukey’s test (a, b) and two-tailed Student’s t test (b−f). Scale bars: 20 μm (a, f). Source data are provided as a Source Data file.
|