|
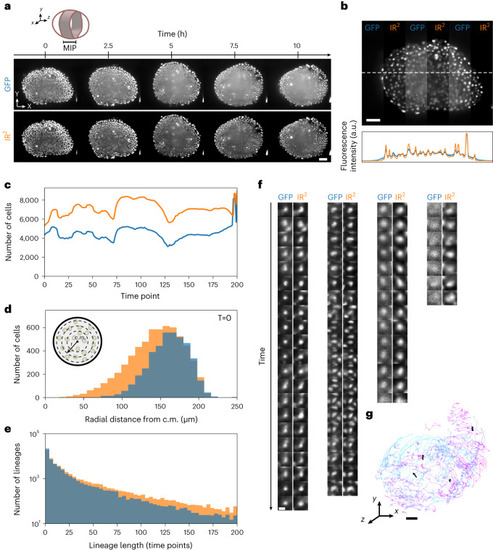
Image restoration of developing pescoid. a, MIPs of z planes between 240 and 280 µm deep inside a pescoid (cartoon) developing over the course of approximately 10 h. Live GFP images (top) and the images reconstructed using IR2 (bottom). Scale bar, 50 µm. b, A single z plane from the volume acquired at the first time point, where GFP and IR2 images have been alternated in vertical stripes (top). The plot profile along the white dashed line in the GFP (blue) and IR2 images (orange) (bottom). Scale bar, 50 µm. c, Number of cells detected over time in the GFP (blue) and IR2 (orange) volumes. d, Number of cells detected in GFP (blue) and IR2 (orange) images at the first time point as a function of the distance from the center of mass (c.m.) (inset). e, Distribution of track lengths in GFP (blue) and IR2 (orange) time-lapse images. f, Example of images from cell tracks in GFP and IR2 time lapse. Scale bar, 5 µm. g, 3D representation of tracks longer than 50 time points, color coded for time (light blue indicates early time points and violet indicates late time points). Black lines indicate tracks represented in f. Scale bar, 50 µm.
|