
FIGURE
Fig. 6
Fig. 6
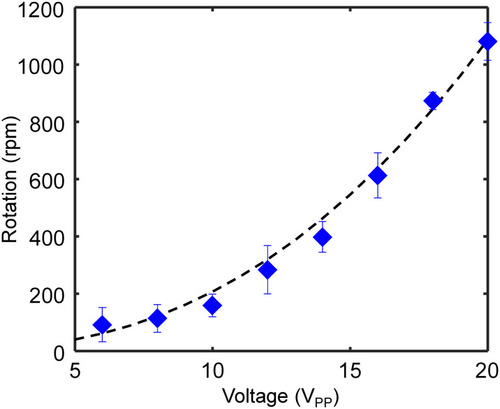
Plot of the rotational velocity of zebrafish larvae against ultrasound excitation voltage. The ultrasound excitation frequency was kept at 185 kHz. The black dotted curve denotes the fitting with the power function expression, |
Expression Data
Expression Detail
Antibody Labeling
Phenotype Data
Phenotype Detail
Acknowledgments
This image is the copyrighted work of the attributed author or publisher, and
ZFIN has permission only to display this image to its users.
Additional permissions should be obtained from the applicable author or publisher of the image.
Full text @ Lab Chip