
- Title
-
A vibrating capillary for ultrasound rotation manipulation of zebrafish larvae
- Authors
- Zhang, Z., Cao, Y., Caviglia, S., Agrawal, P., Neuhauss, S.C.F., Ahmed, D.
- Source
- Full text @ Lab Chip
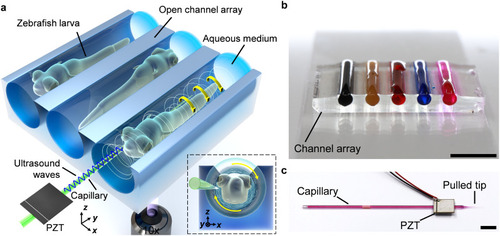
Acoustofluidic micromanipulation system for zebrafish larvae. a) Illustration of the system consisting of an acoustofluidic device and a liquid-filled open channel array. The inset shows rotation of a zebrafish larva from a cross-sectional perspective. b) The channel array represented by water stained with various colors. Scale bar, 5 mm. c) Feature of the acoustofluidic device, where a piezoelectric transducer is bonded on a glass capillary represented by water stained magenta. Scale bar, 5 mm. |
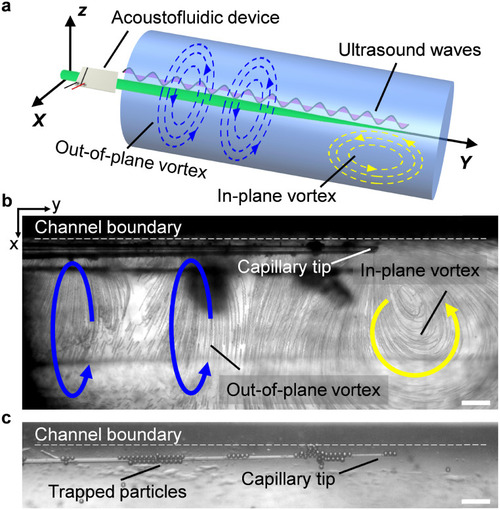
Acoustofluidic behavior of the vibrating capillary in an open liquid channel. a) Schematic of the polarized vortex. Blue and yellow curved arrows denote the out-of-plane vortex and in-plane vortex, respectively. b) Visualization of both the out-of-plane vortex and in-plane vortex using 2 μm polystyrene particles. The ultrasound excitation frequency and voltage were 185 kHz and 4 VPP, respectively. c) Trapping of 15 μm polystyrene particles around the capillary in liquid. The ultrasound excitation frequency and voltage were 185 kHz and 6 VPP, respectively. Scale bar, 100 μm. |
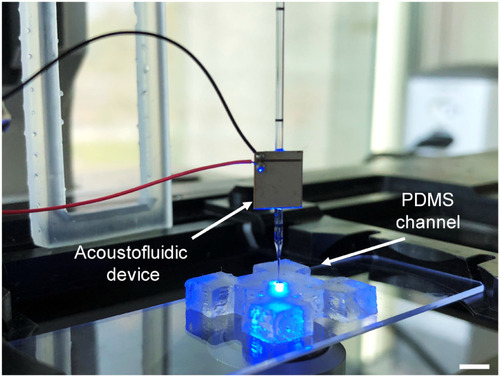
Experimental setup for cross-section flow profile analysis. Scale bar, 5 mm. |
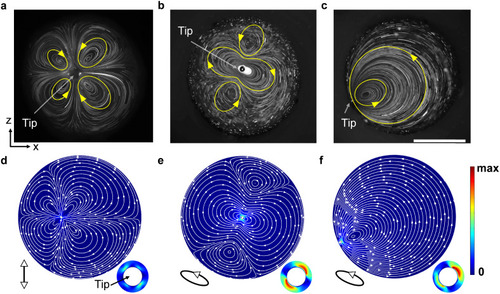
Experimental and simulated flow profiles viewed in cross-section. a) Flow profile developed with ultrasound excitation frequency at 240 kHz. b) Flow profile developed with ultrasound excitation frequency at 185 kHz. In both profiles, the glass capillary was placed near the center of the channel. c) Flow profile developed with the ultrasound excitation frequency at 185 kHz and the glass capillary placed close to the channel boundary. The ultrasound excitation voltage was kept at 1 VPP. Yellow curves show the developed streaming. Scale bar, 500 μm. d) Flow profile simulation in linear vibrating mode. e) Flow profile simulation in elliptical vibrating mode. f) Flow profile simulation in elliptical vibrating mode with the capillary near the channel boundary. White curves show the developed streaming, while the arrow shows streaming direction and the background color denotes streaming velocity. The vibrating magnitude of the capillary tip was set at 1 nm. Diagrams demonstrate the vibrating mode and direction. Insets show a zoomed-in view of the capillary tips. |
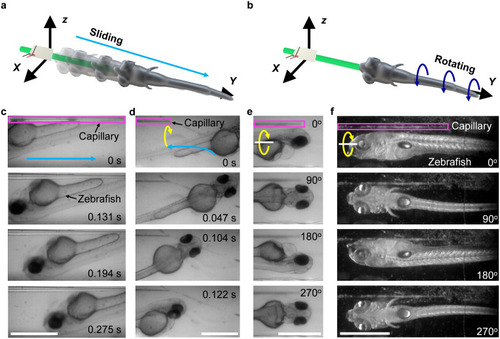
Trapping and rotation of zebrafish larvae. a) Schematic of zebrafish trapping. b) Schematic of zebrafish rotation. c) A zebrafish larva is trapped and slides down the glass capillary toward the tip. d) A zebrafish larva in front of the capillary is trapped and slides toward the tip. The light-blue lines denote the trajectories of the trapped zebrafish larvae. e) Multiple view angles of a rotating 4 dpf zebrafish larva. Ultrasound excitation frequency and voltage were 185 kHz and 12 VPP, respectively. f) Multiple view angles of a rotating 8 dpf zebrafish larva. Ultrasound excitation frequency and voltage were 185 kHz and 15 VPP, respectively. Yellow curves show the rotating directions. The magenta box denotes the vibrating capillary. Scale bar, 500 μm. |
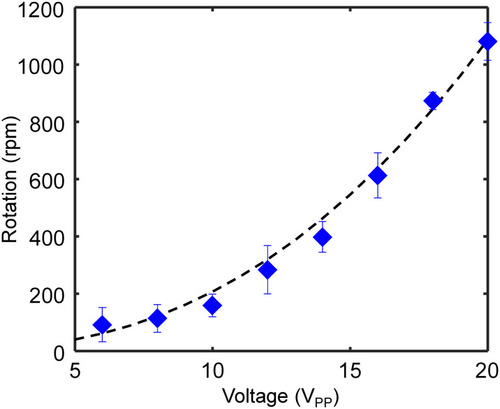
Plot of the rotational velocity of zebrafish larvae against ultrasound excitation voltage. The ultrasound excitation frequency was kept at 185 kHz. The black dotted curve denotes the fitting with the power function expression, |
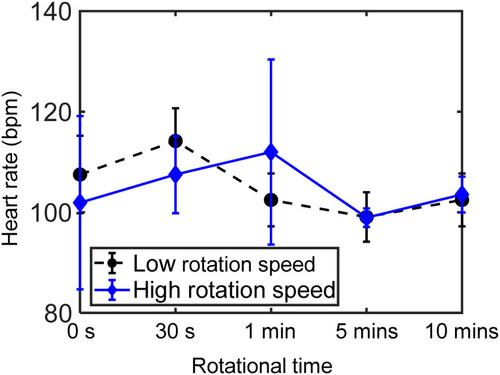
Viability of the rotated zebrafish larvae |
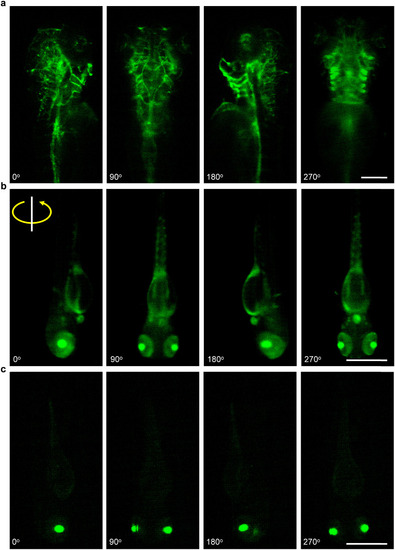
Multiple view angles of fluorescently labeled zebrafish larvae. a) Blood vessel distribution in a |
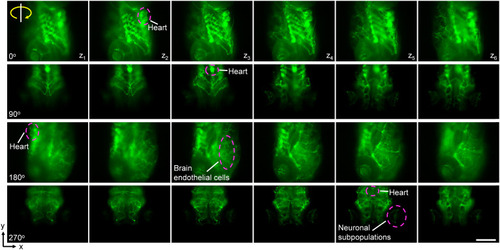
3D visualization of the fluorescently labeled blood vasculature and neurons. The label of |
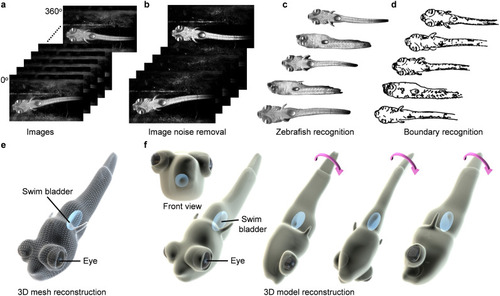
3D reconstruction of a zebrafish larva. a) Multi-view 2D images captured during rotation manipulation. b) Filtering of recorded images to remove noise. c) Detected zebrafish larva by removing the background. d) Identifying the boundaries of the zebrafish larva at different angles and matching them together. e) Reconstruction of a 3D model using point clouds and joining the points with triangular elements. f) A rendered reconstructed 3D model of the zebrafish larva. |