
Fig. 4
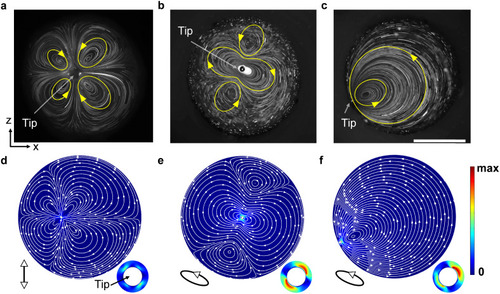
Experimental and simulated flow profiles viewed in cross-section. a) Flow profile developed with ultrasound excitation frequency at 240 kHz. b) Flow profile developed with ultrasound excitation frequency at 185 kHz. In both profiles, the glass capillary was placed near the center of the channel. c) Flow profile developed with the ultrasound excitation frequency at 185 kHz and the glass capillary placed close to the channel boundary. The ultrasound excitation voltage was kept at 1 VPP. Yellow curves show the developed streaming. Scale bar, 500 μm. d) Flow profile simulation in linear vibrating mode. e) Flow profile simulation in elliptical vibrating mode. f) Flow profile simulation in elliptical vibrating mode with the capillary near the channel boundary. White curves show the developed streaming, while the arrow shows streaming direction and the background color denotes streaming velocity. The vibrating magnitude of the capillary tip was set at 1 nm. Diagrams demonstrate the vibrating mode and direction. Insets show a zoomed-in view of the capillary tips. |