
FIGURE
Fig. 1
- ID
- ZDB-FIG-231227-25
- Publication
- St Mary et al., 2023 - Comparative analysis between zebrafish and an automated live-cell assay to classify developmental neurotoxicant chemicals
- Other Figures
- All Figure Page
- Back to All Figure Page
Fig. 1
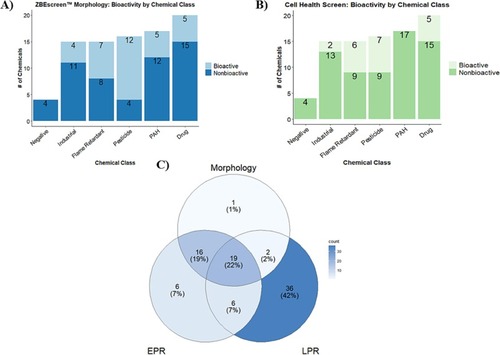
Bioactivity across the SYSTEMETRIC® Cell Health Screen and the ZBEscreen™. Bar plots of DNT chemical library bioactivity as identified by A) ZBEscreen™ mortality/morphological assessments and B) CHI™ categorized by chemical class C) Venn diagram of bioactivity across the morphological and behavioral (EPR and LPR) assessments of the DNT chemical library in the ZBEscreen™. |
Expression Data
Expression Detail
Antibody Labeling
Phenotype Data
Phenotype Detail
Acknowledgments
This image is the copyrighted work of the attributed author or publisher, and
ZFIN has permission only to display this image to its users.
Additional permissions should be obtained from the applicable author or publisher of the image.
Full text @ Tox. App. Pharmacol.