
Image
|
Figure Caption
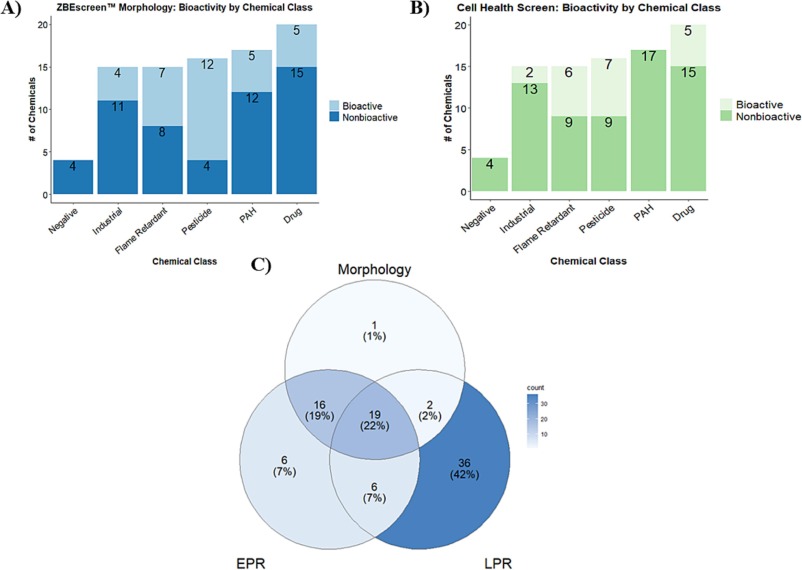
Fig. 1 Bioactivity across the SYSTEMETRIC® Cell Health Screen and the ZBEscreen™. Bar plots of DNT chemical library bioactivity as identified by A) ZBEscreen™ mortality/morphological assessments and B) CHI™ categorized by chemical class C) Venn diagram of bioactivity across the morphological and behavioral (EPR and LPR) assessments of the DNT chemical library in the ZBEscreen™.
Acknowledgments
This image is the copyrighted work of the attributed author or publisher, and
ZFIN has permission only to display this image to its users.
Additional permissions should be obtained from the applicable author or publisher of the image.
Full text @ Tox. App. Pharmacol.