
Fig. 5
- ID
- ZDB-FIG-231227-29
- Publication
- St Mary et al., 2023 - Comparative analysis between zebrafish and an automated live-cell assay to classify developmental neurotoxicant chemicals
- Other Figures
- All Figure Page
- Back to All Figure Page
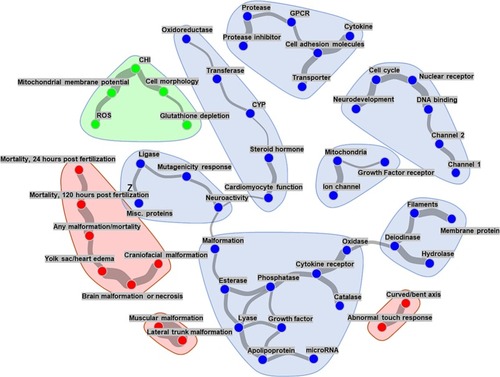
Links between the distinct physiological subsystems tested. The graphical network model shows each assay readout as a node in a graph, and edges between nodes represent conditional dependencies between assays' endpoints. The presence and line thickness show the strength of these dependencies (a thicker line indicates stronger association). For the sake of clarity, readouts without corresponding edges are omitted from the network. The blue points indicate CompTOX-curated assay endpoints, whereas the red and green points represent ZBEscreen™️ and CHS endpoint readouts, respectively. (For interpretation of the references to colour in this figure legend, the reader is referred to the web version of this article.) |