|
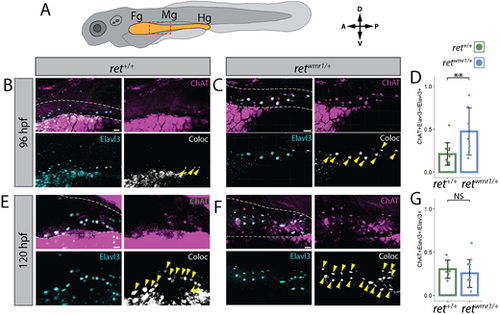
retwmr1/+ ENCCs display accelerated neuron immunoreactive signatures. (A) Cartoon larvae denotes foregut (Fg), midgut (Mg) and hindgut (Hg) intestine (yellow) with red box indicating foregut-midgut boundary region of interest from which representative images are displayed. (B,C,E,F) Whole-mount immunohistochemistry performed using antibodies targeting ChAT and Elavl3. Representative images reveal ChAT (magenta) and Elavl3 (cyan) expression, and their colocalized (coloc) channel (white) within gut tube (white dashed outline) at 96 hpf (B,C) and 120 hpf (E,F). Yellow arrowheads indicate co-positive ChAT+/Elavl3+ ENCCs. (D,G) Percent co-positive ChAT+/Elavl3+ calculated from total Elavl3+ enteric neurons at 96 hpf (**P=0.0083) (D) and 120 hpf (NS) (G). In D ret+/+ n=11, retwmr1/+ n=7; in G ret+/+ n=6, retwmr1/+ n=10. Data are mean±s.e.m. Scale bars: 20 µm (B,C,F); 15 µm (E).
|