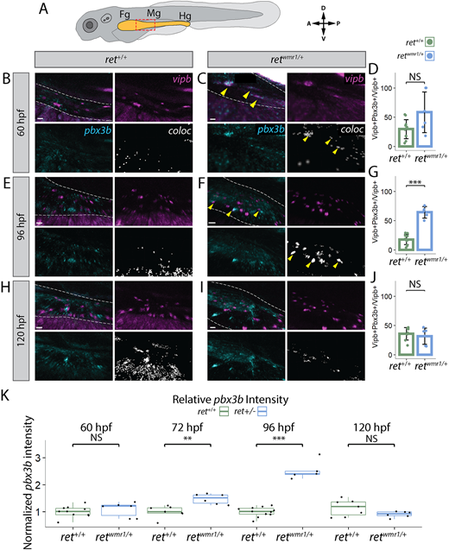
retwmr1/+ ENCCs display accelerated neuron differentiation gene expression. (A-K) Hybridization chain reaction (HCR) performed using probes targeting pbx3b and vipb transcripts. (A) Cartoon larvae denotes foregut (Fg), midgut (Mg) and hindgut (Hg) intestine (yellow) with red box indicating foregut-midgut boundary region of interest from which representative images are displayed. Representative images reveal vipb (magenta) and pbx3b (cyan) expression, and their colocalized (coloc) channel (white) within the gut tube (white dashed outline) at 60 hpf (B,C), 96 hpf (E,F) and 120 hpf (H,I). Yellow arrowheads indicate co-positive vipb+/pbx3b+ ENCCs. (D,G,J) Quantification of percentage co-positive vipb+/pbx3b+ calculated from total vipb+ ENCCs at 60 hpf (D), 96 hpf (G) (Wilcoxon signed-rank test, ***P=0.00046) and 120 hpf (J). In D ret+/+ n=11, retwmr1/+ n=6; in G ret+/+ n=11, retwmr1/+ n=5; in J ret+/+ n=8, retwmr1/+ n=6. Data are mean±s.e.m. (K) Mean pbx3b channel intensity quantified throughout entire gut tube and normalized to ret+/+ average intensity at 60 hpf (Wilcoxon signed-rank test, NS), 72 hpf (Wilcoxon signed-rank test, **P=0.00117), 96 hpf (Wilcoxon signed-rank test, ***P=0.00046) and 120 hpf (Wilcoxon signed-rank test, NS). Box plots show median values (middle bars), and first to third interquartile ranges (boxes). Whiskers indicate 1.5× the interquartile ranges; dots indicate normalised mean pixel intensity of pbx3b fluorescence throughout the entire gut of individual fish. Scale bars: 20 µm (B,C,I); 15 µm (E); 30 µm (F); 10 µm (H). A, anterior; D, dorsal; NS, not significant; P, posterior; V, ventral.
|
