
- Title
-
In Toto imaging of early enteric nervous system Development reveals that gut colonization is tied to proliferation downstream of ret
- Authors
- Baker, P.A., Ibarra-García-Padilla, R., Venkatesh, A., Singleton, E.W., Uribe, R.A.
- Source
- Full text @ Development
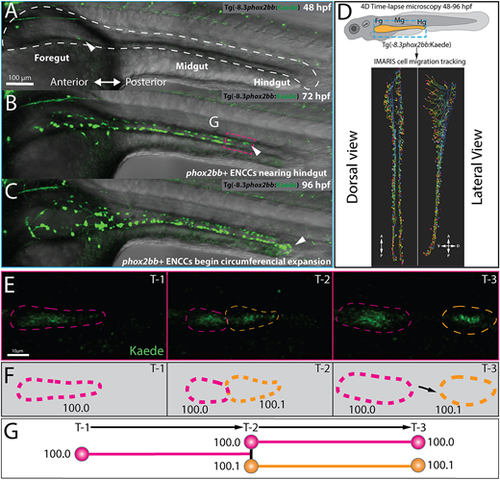
Single-cell generation tracing of ENCCs during early ENS development in toto. (A-C) Still images from time-lapse reveal phox2bb+ ENCCs emerging into foregut intestine at 48 hpf (A, white arrow), leading ENCCs reaching the hindgut at 72 hpf (B, white arrow) and the circumferential expansion of ENCCs at 96 hpf (C). Dashed white line in A shows an outline of the gut tube region of interest. (D) Schematic (top) illustrates region of interests for time-lapse microscopy of ENCC migration in intestine and lateral and dorsal view snapshots (bottom) of single-cell migration tracking in Imaris. (E) Expanded images of cell migration and division at the ENCC wavefront (boxed area, B). Time-points 1-3 (T1-3) depict representative time-points at which cell divisions occur. (F) Cartoon corresponds to cell outlines in panel E (dashed lines) and with representative unique ID labels that denote cell generation number as a decimal. (G) Cartoon generation-tree corresponds to cell divisions seen in panels E and F and depict how unique IDs are applied to cells throughout the time-lapse. A, anterior; D, dorsal; P, posterior; V, ventral. EXPRESSION / LABELING:
PHENOTYPE:
|
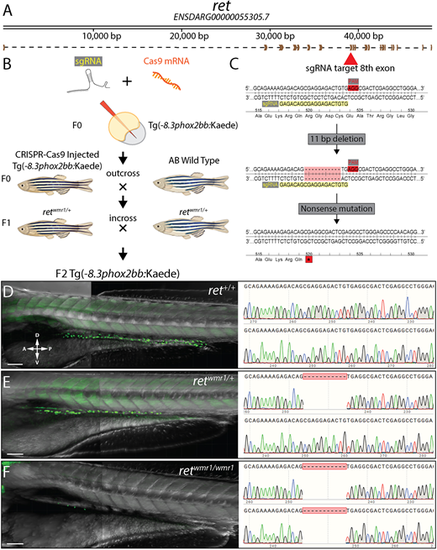
A novel CRISPR-Cas9 generated ret zebrafish mutant. (A) Schematic of receptor tyrosine kinase gene, ret and its resulting mRNA. (B) Diagram depicting injection of sgRNA and Cas9 mRNA into ret+/+ Tg(−8.3phox2bb:Kaede) and crosses used to isolate single CRISPR generate lesion within ret allele. (C) Zoomed in region of coding sequence of exon 8 (red arrow) targeted by sgRNA sequence (GAGACAGCGAGGAGACTGTG, yellow highlight) adjacent to PAM motif (red highlight). CRISPR-Cas9 activity at this locus generated an 11 bp deletion that resulted in nonsense mutation (stop codon, asterisk). (D-F) Representative images (left) and resulting genotypes (right) from in-crossing F1 heterozygotes harboring nonsense mutation (retwmr1/+), which produces phenotypic WT (ret+/+) (D), hypoganglionosis or HSCR-like (retwmr1/+) (E) and total aganglionosis (retwmr1/ wmr1) (F). Scale bars: 100 µm. A, anterior; D, dorsal; P, posterior; V, ventral. EXPRESSION / LABELING:
PHENOTYPE:
|
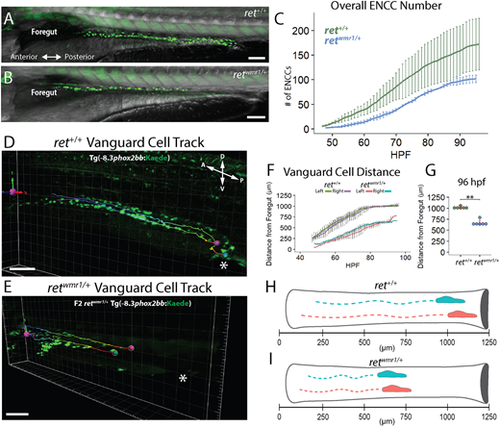
retwmr1/+ fish display a reduction in total ENCC number and migratory extent along the gut. (A,B) Images of ret+/+ (A) and retwmr1/+ Tg(−8.3phox2bb:Kaede) (B) fish show phox2bb+ ENCCs within the intestine at 96 hpf. retwmr1/+ ENCCs fail to reach distal hindgut at 96 hpf. (C) Average number of ENCCs present during the 48-96 hpf time-lapse in ret+/+ and retwmr1/+ fish (n=3). (D,E) Snapshot of final 96 hpf time-point depicts migratory track of leading-edge cell (vanguard) in left (pink spot) and right (blue spot) ENCC chains (cloaca, white asterisk). (F) Average distance traveled by left and right vanguard cells in ret+/+ and retwmr1/+ fish compared across 48-96 hpf (n=6 per condition; data are mean±s.e.m.). (G) Final position of vanguard cells at 96 hpf (Wilcoxon signed-rank test, **P=0.0022). (H,I) Schematic depicts vanguard cells in left (pink) and right (blue) ENCC migratory chains in (H) ret+/+ and (I) retwmr1/+. Scale bars: 100 µm. A, anterior; D, dorsal; P, posterior; V, ventral. EXPRESSION / LABELING:
PHENOTYPE:
|
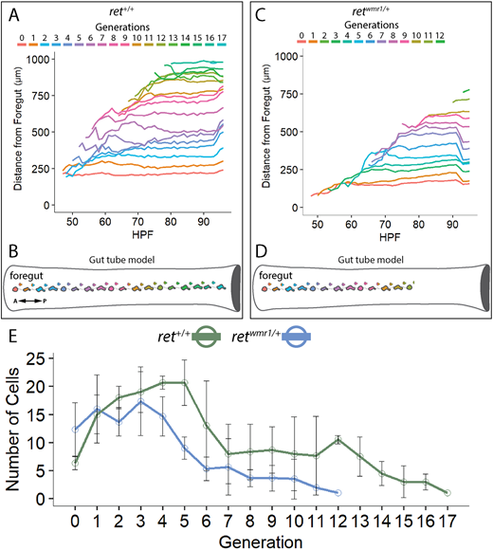
Generation of new ENCCs along the gut is compromised in retwmr1/+ fish. (A-D) ENCC proliferation produces successive generations of cells that migrate further than predecessors along the A-P axis of the gut tube. (A,B) ret+/+ ENCCs produce up to 18 generations to effectively colonize the entire gut tube (n=3). (C,D) retwmr1/+ ENCCs produce up to 13 generations that successively colonize the gut tube but fail to reach the hindgut (n=3). (E) Average number of cells per given generation are reduced in retwmr1/+ fish when compared with ret+/+. Data are mean±s.e.m. A, anterior; P, posterior. PHENOTYPE:
|
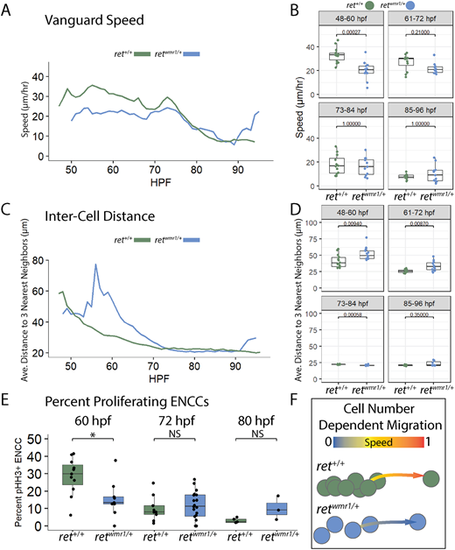
Proliferation-deficient retwmr1/+ ENCCs highlight cell density-associated migration mechanism during ENS formation. (A,B) Average speed of vanguard cell migration reveals a reduction in retwmr1/+ ENCC speed during the key cell migration window of 48-60 hpf (n=6 per condition; Wilcoxon signed-rank test, P=0.00027). (C,D) Average distance to three nearest neighbors was calculated for each ENCC within an individual population and then averaged across conditional replicates and plotted versus hpf for both ret+/+ and retwmr1/+ fish (n=3 per condition). Significantly higher distances between neighbors were observed among retwmr1/+ ENCCs at 48-60 hpf (Wilcoxon signed-rank test, P=0.00940) and 61-72 hpf (Wilcoxon signed-rank test, P=0.00870), indicative of lower cell density. (E) Percent proliferating ENCCs was calculated using whole-mount immunofluorescence performed using Tg(−8.3phox2bb:Kaede) fish in combination with anti-pHH3 and anti-Kaede antibodies to calculate the percent pHH3+, Kaede+ ENCCs at 60 hpf, 72 hpf and 80 hpf. retwmr1/+ fish displayed a lower percentage of proliferating ENCCs at 60 hpf (Wilcoxon signed-rank test, *P=0.02). NS, not significant. Box plots show median values (middle bars), and first to third interquartile ranges (boxes). Whiskers indicate 1.5× the interquartile ranges; dots indicate mean values per hpf within the given time window. (F) Graphic depicts density-dependent migration model in which more densely spaced ret+/+ ENCCs display higher speeds of migration than less densely spaced retwmr1/+ ENCCs. EXPRESSION / LABELING:
PHENOTYPE:
|
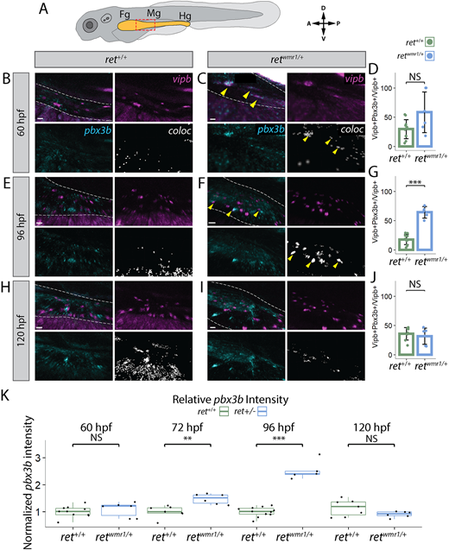
retwmr1/+ ENCCs display accelerated neuron differentiation gene expression. (A-K) Hybridization chain reaction (HCR) performed using probes targeting pbx3b and vipb transcripts. (A) Cartoon larvae denotes foregut (Fg), midgut (Mg) and hindgut (Hg) intestine (yellow) with red box indicating foregut-midgut boundary region of interest from which representative images are displayed. Representative images reveal vipb (magenta) and pbx3b (cyan) expression, and their colocalized (coloc) channel (white) within the gut tube (white dashed outline) at 60 hpf (B,C), 96 hpf (E,F) and 120 hpf (H,I). Yellow arrowheads indicate co-positive vipb+/pbx3b+ ENCCs. (D,G,J) Quantification of percentage co-positive vipb+/pbx3b+ calculated from total vipb+ ENCCs at 60 hpf (D), 96 hpf (G) (Wilcoxon signed-rank test, ***P=0.00046) and 120 hpf (J). In D ret+/+ n=11, retwmr1/+ n=6; in G ret+/+ n=11, retwmr1/+ n=5; in J ret+/+ n=8, retwmr1/+ n=6. Data are mean±s.e.m. (K) Mean pbx3b channel intensity quantified throughout entire gut tube and normalized to ret+/+ average intensity at 60 hpf (Wilcoxon signed-rank test, NS), 72 hpf (Wilcoxon signed-rank test, **P=0.00117), 96 hpf (Wilcoxon signed-rank test, ***P=0.00046) and 120 hpf (Wilcoxon signed-rank test, NS). Box plots show median values (middle bars), and first to third interquartile ranges (boxes). Whiskers indicate 1.5× the interquartile ranges; dots indicate normalised mean pixel intensity of pbx3b fluorescence throughout the entire gut of individual fish. Scale bars: 20 µm (B,C,I); 15 µm (E); 30 µm (F); 10 µm (H). A, anterior; D, dorsal; NS, not significant; P, posterior; V, ventral. |
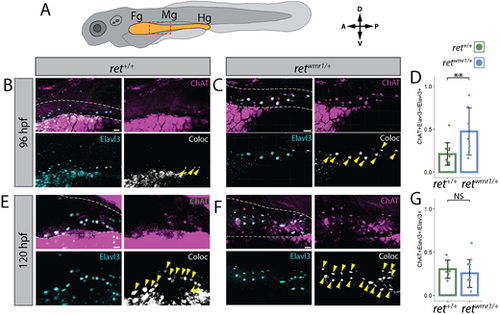
retwmr1/+ ENCCs display accelerated neuron immunoreactive signatures. (A) Cartoon larvae denotes foregut (Fg), midgut (Mg) and hindgut (Hg) intestine (yellow) with red box indicating foregut-midgut boundary region of interest from which representative images are displayed. (B,C,E,F) Whole-mount immunohistochemistry performed using antibodies targeting ChAT and Elavl3. Representative images reveal ChAT (magenta) and Elavl3 (cyan) expression, and their colocalized (coloc) channel (white) within gut tube (white dashed outline) at 96 hpf (B,C) and 120 hpf (E,F). Yellow arrowheads indicate co-positive ChAT+/Elavl3+ ENCCs. (D,G) Percent co-positive ChAT+/Elavl3+ calculated from total Elavl3+ enteric neurons at 96 hpf (**P=0.0083) (D) and 120 hpf (NS) (G). In D ret+/+ n=11, retwmr1/+ n=7; in G ret+/+ n=6, retwmr1/+ n=10. Data are mean±s.e.m. Scale bars: 20 µm (B,C,F); 15 µm (E). |