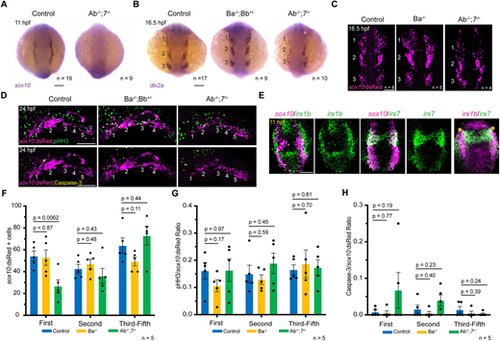
Impaired CNCC development in IrxAb; irx7 mutants. (A) Expression of the CNCC marker sox10 is severely reduced in IrxAb−/−; irx7−/− mutants at 11 hpf. (B) At 16.5 hpf, dlx2a expression marks three streams of neural crest ectomesenchyme (numbered) in wild-type controls. Expression of dlx2a is reduced in IrxAb−/−; irx7−/− mutants, especially in the first stream, but unaffected in IrxBa−/−; IrxBb+/− mutants. (C) sox10:dsRed marks three streams of CNCCs at 16.5 hpf. The first stream is preferentially reduced in IrxAb−/−; irx7−/− mutants but unaffected in IrxBa−/− mutants. (D) sox10:dsRed labels five pharyngeal arches in wild-type controls and IrxBa−/−; IrxBb+/− mutants, but only four arches in IrxAb−/−; irx7−/− mutants. Immunostaining shows proliferating cells (phospho-histoneH3+, pHH3) and apoptotic cells (Caspase-3+). (E) In situ hybridizations at 11 hpf show co-expression of irx1b and irx7 in CNCCs (asterisks), with partial overlap with the neural crest marker sox10. There is also strong expression of irx1b in the pre-placodal domain just lateral to the sox10+ neural crest domain. (F-H) Quantification of sox10:dsRed+ cells, proportion of pHH3+ to sox10:dsRed+ cells, and Caspase-3+ to sox10:dsRed+ cells within the first, second and posterior pharyngeal arches of the indicated genotypes at 24 hpf. P-values were calculated using two-tailed non-parametric Student's t-tests. Error bars represent s.e.m. n denotes individual embryos in which the indicated patterns were observed. Scale bars: 100 µm.
|
