
- Title
-
Comprehensive series of Irx cluster mutants reveals diverse roles in facial cartilage development
- Authors
- Farmer, D.T., Patel, P., Choi, R., Liu, C.Y., Crump, J.G.
- Source
- Full text @ Development
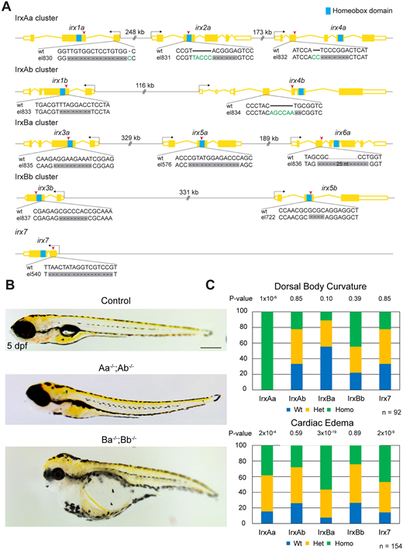
Generation of a complete series of Irx cluster mutants in zebrafish. (A) Schematic of CRISPR/Cas9 strategy to generate Irx cluster mutants. All selected alleles result in frame-shift mutations (red arrowheads). Dashes indicate deleted nucleotides, and green letters indicate insertions. All alleles are predicted to delete or truncate the DNA-binding homeobox domain (blue box). (B) Brightfield images showing dorsal axis curvature in the absence of IrxA genes and cardiac edema in the absence of IrxB genes. (C) Summary of genotypes for the indicated phenotypes from a quintuple heterozygous in-cross. P-values report chi-square tests for deviation from the expected 1:2:1 wild type:heterozygous:homozygous Mendelian ratio. Scale bar: 1 mm. |

Requirement for IrxB genes in pectoral fin development. (A) Alcian Blue (cartilage) and Alizarin Red (bone) staining of pectoral fins shows reductions of the scapulocoracoid cartilage in IrxBa−/−; IrxBb+/− mutants. (B) Summary of genotypes for the reduced pectoral girdle phenotype from a quintuple heterozygous in-cross. P-values report chi-square tests for deviation from the expected 1:2:1 wild type:heterozygous:homozygous Mendelian ratio. (C) Model highlighting the conserved roles of IrxB genes in development of proximal structures of the mouse forelimb and zebrafish pectoral fin. Green shading indicates regions for which development is dependent on IrxB/IrxBa. Cl, cleithrum; ED, endoskeletal disc cartilage; Hu, humerus; POP, postcoracoid process; Ra, radius; S, scapula; Sc, scapulocoracoid cartilage; Ul, ulna. Scale bar: 100 µm. |
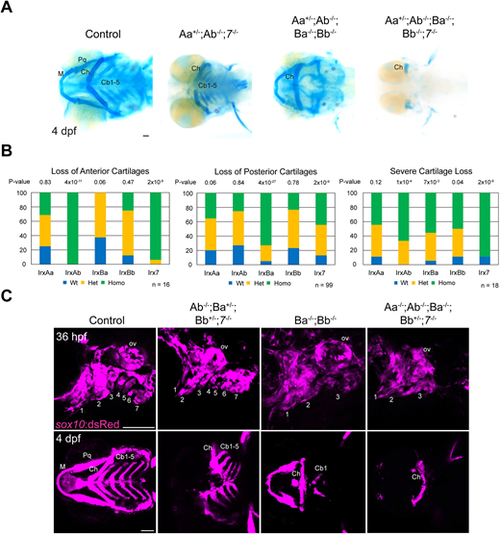
Facial cartilage reductions in Irx mutants. (A) Ventral views of larvae stained with Alcian Blue (cartilage). Three phenotypic groups were identified in Irx mutants: anterior cartilage loss (left), posterior cartilage loss (middle), and near-complete cartilage loss (right). (B) Summary of genotypes for the indicated phenotypes from a quintuple heterozygous in-cross. P-values report chi-square tests for deviation from the expected 1:2:1 wild type:heterozygous:homozygous Mendelian ratio. (C) Sequential confocal imaging of individual zebrafish shows that reductions of the first and second arches (numbered) precede loss of mandibular cartilages (left), reductions of posterior arches 3-7 precede absence of ceratobranchial cartilages (middle), and reductions of all arches precede severe cartilage loss (right). Genotypes of specific examples are shown. Cb1-5, ceratobranchials 1-5; Ch, ceratohyal; M, Meckel's; ov, otic vesicle; Pq, palatoquadrate. Scale bars: 100 µm. PHENOTYPE:
|
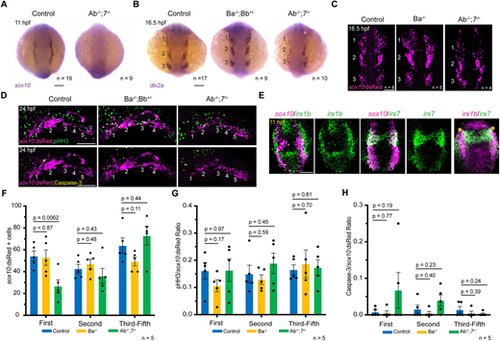
Impaired CNCC development in IrxAb; irx7 mutants. (A) Expression of the CNCC marker sox10 is severely reduced in IrxAb−/−; irx7−/− mutants at 11 hpf. (B) At 16.5 hpf, dlx2a expression marks three streams of neural crest ectomesenchyme (numbered) in wild-type controls. Expression of dlx2a is reduced in IrxAb−/−; irx7−/− mutants, especially in the first stream, but unaffected in IrxBa−/−; IrxBb+/− mutants. (C) sox10:dsRed marks three streams of CNCCs at 16.5 hpf. The first stream is preferentially reduced in IrxAb−/−; irx7−/− mutants but unaffected in IrxBa−/− mutants. (D) sox10:dsRed labels five pharyngeal arches in wild-type controls and IrxBa−/−; IrxBb+/− mutants, but only four arches in IrxAb−/−; irx7−/− mutants. Immunostaining shows proliferating cells (phospho-histoneH3+, pHH3) and apoptotic cells (Caspase-3+). (E) In situ hybridizations at 11 hpf show co-expression of irx1b and irx7 in CNCCs (asterisks), with partial overlap with the neural crest marker sox10. There is also strong expression of irx1b in the pre-placodal domain just lateral to the sox10+ neural crest domain. (F-H) Quantification of sox10:dsRed+ cells, proportion of pHH3+ to sox10:dsRed+ cells, and Caspase-3+ to sox10:dsRed+ cells within the first, second and posterior pharyngeal arches of the indicated genotypes at 24 hpf. P-values were calculated using two-tailed non-parametric Student's t-tests. Error bars represent s.e.m. n denotes individual embryos in which the indicated patterns were observed. Scale bars: 100 µm. EXPRESSION / LABELING:
PHENOTYPE:
|

Requirement of IrxB genes for pharyngeal pouch formation. (A) Confocal images show three bilateral streams of sox10:dsRed+ CNCCs (numbered) and her5:GFP+ endoderm in wild-type sibling controls and IrxBa−/−; IrxBb+/− mutants at 16.5 hpf. (B,C) Lateral views show loss of her5:GFP+ posterior pouches (green, numbered) and reduced numbers of sox10:dsRed+ neural crest-derived arches (magenta, numbered) in IrxBa−/−; IrxBb+/− mutants versus wild-type sibling controls at 24 and 36 hpf. (D) In situ hybridization reveals co-expression of irx3a with the ectomesenchyme marker dlx2a in the third and fourth pharyngeal arch, as well as the intervening dlx2a-negative regions (arrows) where endodermal pouches are located. Boxed region is magnified on the right. b, brain; e, endoderm; Y, yolk. n numbers denote individual embryos in which the indicated patterns were observed. Scale bars: 100 µm. |
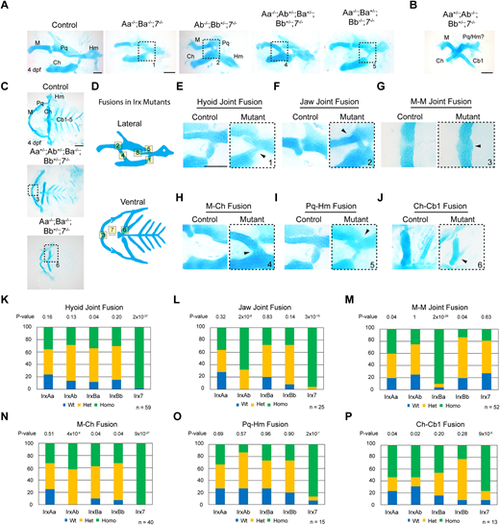
Widespread facial cartilage fusions and joint loss in Irx mutants. (A,B) Dissected first and second arch-derived skeletons shown in lateral view and stained with Alcian Blue (cartilage) at 4 dpf. Distinct combinations of Irx mutations result in a range of cartilage fusions and joint loss (boxed regions) (A), and in severe cases fusions of multiple cartilages (B). (C) Dissected facial cartilages shown in ventral view, with dashed boxes showing cartilage fusions. (D) Schemes of the range of cartilage fusions and joint losses seen in Irx mutant combinations. Numbers correspond to the boxed regions in A and C; see Fig. S4 for fusions 7 and 8. (E-J) Magnifications of the cartilage fusions seen in A and C (boxed regions) versus similar regions from wild-type controls. (K-P) Summary of genotypes for the indicated phenotypes from a quintuple heterozygous in-cross. P-values report chi-square tests for deviation from the expected 1:2:1 wild type:heterozygous:homozygous Mendelian ratio. n denotes animals in which the indicated fusions were observed. Cb, ceratobranchial; Ch, ceratohyal; Hm, hyomandibular; M, Meckel's; Pq, palatoquadrate. Scale bars: 100 µm. PHENOTYPE:
|
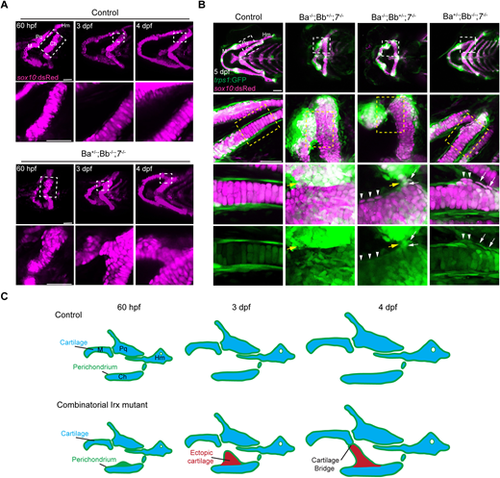
Sequential in vivo imaging of cartilage fusion in Irx mutants. (A) Serial confocal imaging of sox10:dsRed+ facial cartilages in wild-type sibling controls and IrxBa+/−; IrxBb−/−; irx7−/− mutant embryos, with fusion regions indicated with dashed rectangles and magnified below. Ectopic chondrocytes are observed along the mutant ceratohyal cartilage at 60 hpf, which then expand to fuse with Meckel's cartilage by 4 dpf. (B) Confocal imaging of the cartilage marker sox10:dsRed and perichondrium marker trps1:GFP in control and three mutants with severe fusion, mild fusion, or ectopic outgrowth of ceratohyal without fusion. Boxed regions are magnified below, and the merged and single trps1:GFP channels are shown for the highest magnification. The fusion sites are shown by yellow arrows, trps1:GFPhigh; sox10:dsRed+ chondrocytes by white arrows, and trps1:GFPlow; sox10:dsRed+ chondrocytes by arrowheads. (C) Model for cartilage fusion in Irx mutants shows ectopic cartilage outgrowths from the perichondrium resulting in aberrant cartilage bridges between neighboring elements. Ch, ceratohyal; Hm, hyomandibula; M, Meckel's; Pq, palatoquadrate. Scale bars: 50 µm. PHENOTYPE:
|