
Figure 2.
- ID
- ZDB-FIG-231024-9
- Publication
- Massaquoi et al., 2023 - Cell-type-specific responses to the microbiota across all tissues of the larval zebrafish
- Other Figures
- All Figure Page
- Back to All Figure Page
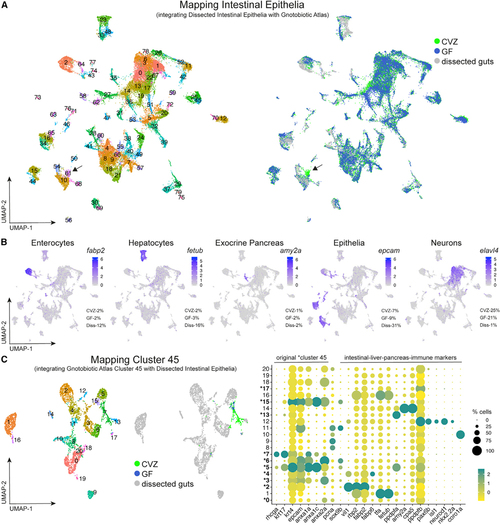
Integration of whole gnotobiotic larval zebrafish cells with dissected larval digestive system cells (A) uMAP plots display integration of single cells dissociated from whole larvae of the Gnotobiotic Atlas and dissected larval guts. (B) Clusters populated by cells from each experimental group confirm and illustrate digestive cell types from dissociation of whole larvae including enterocytes ( (C) uMAP plots show that cells from original epithelial cluster 45 include a minority of cells likely to be of the digestive system. The dot plot, and all following dot plots included in the manuscript, displays both the percentage of cells within a cluster or subcluster expressing a transcript (dot size) and expression level of the transcript (dot color). Expression of genes within this dot plot for a subcluster is relative to all other subclusters. Bolded subcluster numbers designated with an astersk within the dot plot indicate that the subclusters include cells originating from cluster 45 within their subcluster population. Dissected Intestinal Epithelia data were derived from GF larvae to mitigate contamination during the length of time needed to dissect a sufficient amount of sample. Arrows point to Cluster 61 in Mapping Intestinal Epithelia. |