
Figure 4.
- ID
- ZDB-FIG-231024-11
- Publication
- Massaquoi et al., 2023 - Cell-type-specific responses to the microbiota across all tissues of the larval zebrafish
- Other Figures
- All Figure Page
- Back to All Figure Page
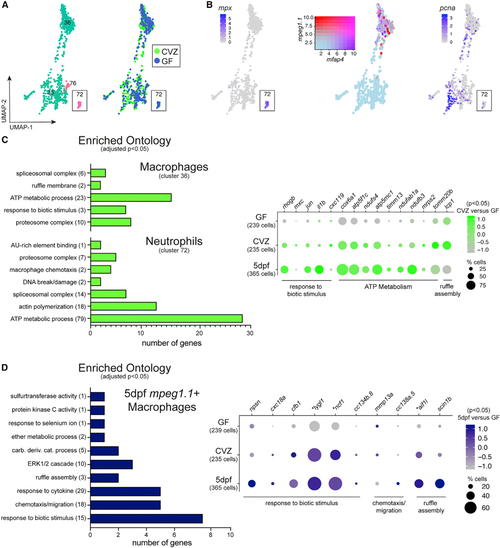
Immune cells exhibit characteristic transcriptional responses to the microbiota (A and B) Clusters 35, 36, 72 and 76 (A) include several immune cell types that differentially express (B) neutrophil biomarker (C) GO analysis plot and dot plot represent genes significantly enriched within CVZ versus GF macrophages and neutrophils, showing similar trends in gene expression compared with conventional 5 dpf larvae of the Zebrafish Atlas. (D) GO analysis plot and dot plot represent genes significantly enriched within CV 5 dpf Zebrafish Atlas macrophages and neutrophils, showing similar trends in gene expression compared with 6 dpf CVZ cells. Genes designated with an asterisk were statistically enriched within CVZ versus GF cells. |