
Figure 3.
- ID
- ZDB-FIG-231024-10
- Publication
- Massaquoi et al., 2023 - Cell-type-specific responses to the microbiota across all tissues of the larval zebrafish
- Other Figures
- All Figure Page
- Back to All Figure Page
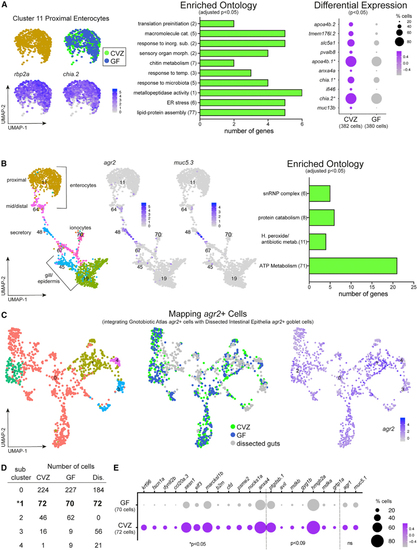
Intestinal enterocytes and secretory cells exhibit cell-type-specific transcriptional responses to the microbiota (A) Cluster 11 is composed of enterocytes from the proximal intestine marked by high expression of (B) Mucin-secreting cells are localized to cluster 48 indicated by expression of (C) uMAP plots display integration of all (D) Subcluster 1 demonstrates consistent pairing of cells from each experimental group from the integration. (E) Dot plot illustrates enriched expression of several genes within CVZ cells of subcluster 1. GO plots in this figure and all following figures use bars to show the total number of genes included in a GO category. The number in parentheses displayed after a GO category title on the y axis signifies the number of GO terms binned into the category. GO terms are considered significant at p < 0.05 after a false discovery rate (FDR) p-corrected adjustment. |