|
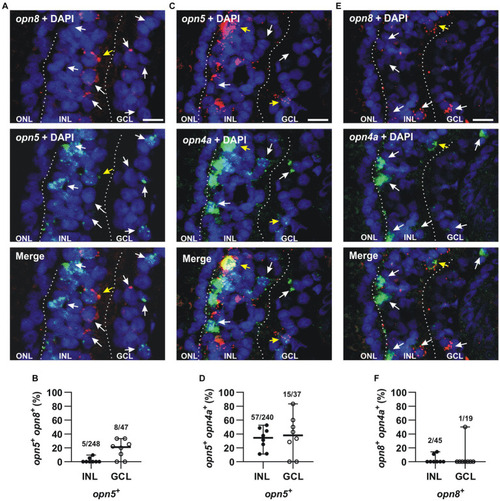
opn5 and opn8 sparsely co-express in the GCL but not INL, while opn4 and opn5 are partially co-expressed in both GCL and INL, and opn4 and opn8 do not co-express. (A,C,E) Double FISH against opn5 (green) and opn8 (red) (A), opn5 (red) and opn4a (green) (C), and opn8 (red) and opn4a (green) (E) on stage 43/44 X. laevis transverse retinal sections. DAPI (blue) stained the nucleus and is shown with the merged image. White arrows point to cells that express a single opsin, while yellow arrows point to cells that express two opsins. GCL, ganglion cell layer; INL, inner nuclear layer; ONL, outer nuclear layer. Scale bar = 20 μm. (B,D,F) Graphs showing distribution between the INL and GCL of cells that co-express opn5 and opn8(B), opn5 and opn4a(D) and opn8 and opn4a(F). Each dot represents the percentage of cells in one central retina section [n = 8 sections, (B,D,F)]. Lines are the mean with 95% confidence interval.
|