IMAGE

Figure 5

ID
ZDB-IMAGE-231006-6
Source
Figures for Man et al., 2023
Image
Figure Caption

Figure 5

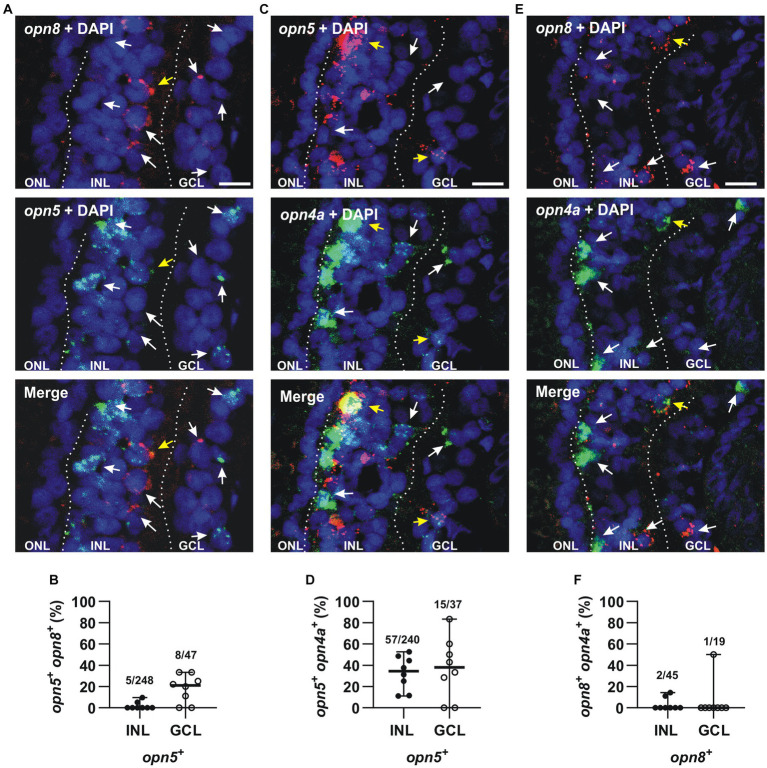
opn5 and opn8 sparsely co-express in the GCL but not INL, while opn4 and opn5 are partially co-expressed in both GCL and INL, and opn4 and opn8 do not co-express. (A,C,E) Double FISH against opn5 (green) and opn8 (red) (A), opn5 (red) and opn4a (green) (C), and opn8 (red) and opn4a (green) (E) on stage 43/44 X. laevis transverse retinal sections. DAPI (blue) stained the nucleus and is shown with the merged image. White arrows point to cells that express a single opsin, while yellow arrows point to cells that express two opsins. GCL, ganglion cell layer; INL, inner nuclear layer; ONL, outer nuclear layer. Scale bar = 20 μm. (B,D,F) Graphs showing distribution between the INL and GCL of cells that co-express opn5 and opn8(B), opn5 and opn4a(D) and opn8 and opn4a(F). Each dot represents the percentage of cells in one central retina section [n = 8 sections, (B,D,F)]. Lines are the mean with 95% confidence interval.

Acknowledgments
This image is the copyrighted work of the attributed author or publisher, and ZFIN has permission only to display this image to its users. Additional permissions should be obtained from the applicable author or publisher of the image. Full text @ Front. Cell. Neurosci.