
Fig. 1
- ID
- ZDB-FIG-231002-12
- Publication
- Zhou et al., 2023 - Progenitor-derived glia are required for spinal cord regeneration in zebrafish
- Other Figures
- All Figure Page
- Back to All Figure Page
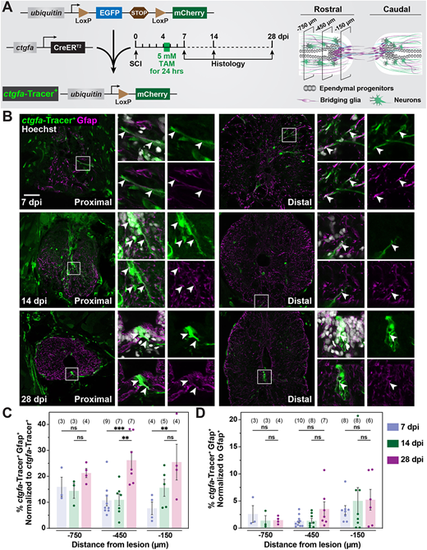
Contribution of ctgfa+ cells to regenerating glia during SC repair. (A) Experimental timeline to evaluate the contribution of ctgfa+ cells after SCI. ctgfa-Tracer animals refer to the compound transgenic line −5.5Kb-ctgfa:CreERT2; ubiquitin:loxP-GFP-STOP-loxP-mCherry. ctgfa-Tracer fish were subjected to complete SC transection and tamoxifen (TAM)-mediated recombination at 4 dpi to enable permanent mCherry labeling in ctgfa+ and ctgfa+-derived cells. SC tissues were collected at 7, 14 and 28 dpi. Schematic of SC tissue illustrates cross-sections at 150, 450 and 750 µm rostral to the lesion that were analyzed for histological examination. The 7 dpi time point was used to assess recombination following TAM treatment. The 14 and 28 dpi time points were used to trace the fates of ctgfa+-derived cells. (B) Immunostaining for mCherry (green), Gfap (magenta), and nuclear Hoechst (gray) at 7, 14 and 28 dpi. mCherry expression, referred to as ctgfa-Tracer+, is used to trace the fates of ctgfa-expressing cells following TAM-inducible recombination. SC sections from TAM-treated ctgfa-Tracer (Cre+) animals are shown. Cross-sections 150 µm (proximal) or 450 µm (distal) rostral from the lesion site are shown. High-magnification insets show select ctgfa-Tracer+ cells in triple-, double- or single-channel views. Arrowheads indicate ctgfa-Tracer+ cells. (C,D) Quantification of ctgfa-Tracer+ and Gfap+ colocalization at 7, 14 and 28 dpi. SC cross-sections 150, 450, and 750 µm rostral to the lesion were analyzed. ctgfa-Tracer+ and Gfap+ fluorescence were quantified. For each section, ctgfa-Tracer+ Gfap+ fluorescence was normalized to total ctgfa-Tracer+ in C and to total Gfap+ in D. Dots indicate individual animals and sample sizes are indicated in parentheses. Error bars represent s.e.m. ***P<0.001; **P<0.01 (two-way ANOVA). ns, not significant (P>0.05). Scale bar: 50 µm. |