
Fig. 2
- ID
- ZDB-FIG-231002-13
- Publication
- Zhou et al., 2023 - Progenitor-derived glia are required for spinal cord regeneration in zebrafish
- Other Figures
- All Figure Page
- Back to All Figure Page
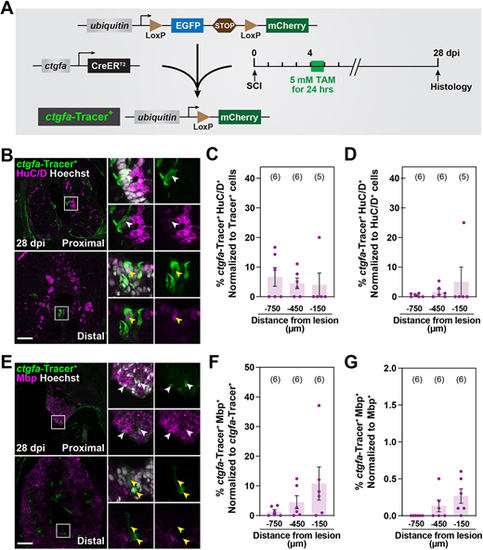
Contribution of ctgfa+ cells to regenerating neurons and oligodendrocytes after SCI. (A) Experimental timeline to evaluate the contribution of ctgfa+ cells after SCI. ctgfa-Tracer animals were subjected to complete SC transection and tamoxifen (TAM)-mediated recombination at 4 dpi to enable permanent mCherry labeling in ctgfa+ and ctgfa+-derived cells. SC tissues were collected at 28 dpi for histological examination. (B) Immunostaining for mCherry (green), HuC/D (magenta) and nuclear Hoechst (gray) at 28 dpi. mCherry expression, referred to as ctgfa-Tracer+, is used to trace the fates of ctgfa-expressing cells following TAM-inducible recombination at 4 dpi. SC sections from TAM-treated ctgfa-Tracer (Cre+) animals are shown. Cross-sections 150 µm (proximal) or 450 µm (distal) rostral from the lesion site are shown. High-magnification insets show select ctgfa-Tracer+ cells in triple-, double- or single-channel views. White arrowheads indicate ctgfa-Tracer+ HuC/D+ cells; yellow arrowheads indicate ctgfa-Tracer− HuC/D+ cells. (C,D) Quantification of ctgfa-Tracer+ and HuC/D+ colocalization at 28 dpi. ctgfa-Tracer Hoechst and HuC/D Hoechst were used to quantify the numbers of ctgfa-Tracer+ and HuC/D+ cells. ctgfa-Tracer+ HuC/D+ cells were normalized to the total number of ctgfa-Tracer+ cells in C, and to the total number of HuC/D+ cells in D. (E) Immunostaining for mCherry (green), Mbp (magenta) and nuclear Hoechst (gray) at 28 dpi. SC sections from TAM-treated ctgfa-Tracer (Cre+) animals are shown. Cross-sections 150 µm (proximal) or 450 µm (distal) rostral from the lesion site are shown. High-magnification insets show select ctgfa-Tracer+ cells in triple-, double- or single-channel views. White arrowheads indicate ctgfa-Tracer+ Mbp+ staining; yellow arrowheads indicate ctgfa-Tracer+ Mbp− staining. (F,G) Quantification of ctgfa-Tracer+ and Mbp+ colocalization at 28 dpi. ctgfa-Tracer+ and Mbp+ fluorescence were quantified. ctgfa-Tracer+ Mbp+ cells were normalized to total ctgfa-Tracer+ in F and to total Mbp+ fluorescence in G. For all quantifications, SC cross-sections 150, 450 and 750 µm rostral to the lesion were analyzed. Dots indicate individual animals and sample sizes are indicated in parentheses. Error bars represent s.e.m. Scale bars: 50 µm. |