|
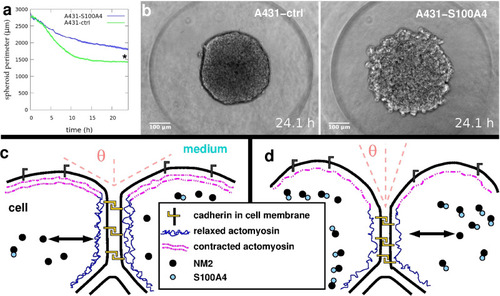
Aggregation dynamics depend on non-muscle myosin 2 assembly. Quantitative analysis of aggregation of A431 cells. a Time-dependent decrease in the mean perimeter of spheroids aggregating from homotypic cell suspension of A431 cells overexpressing either NM2 assembly inhibitor S100A4 (A431-S100A4, n = 10) or its inactive mutant isoform (A431-ctrl, n = 10). Error stripes represent SEM, asterisk (*) at t = 24 h indicates a statistically significant difference with Student’s t-test, p < 0.01. b Representative phase-contrast images from time-lapse videos of spheroids of A431-ctrl cells (left panel) or A431-S100A4 cells (right panel) after 24 h aggregation from suspension. Note the difference in spheroid surface roughness. Scale bar: 100 µm. Also see Supplementary Movie 9 and Supplementary Fig. 3. c, d Schematic representations of surface cells highlighting the cytoskeletal components involved in cortical tension generation. c Normal cells with effective multicellular compaction characterized by large contact angle Θ due to the contracted actomyosin network at the cell-medium surface and relaxed actomyosin at the cell-cell interface coupled by cadherins. Assembly of NM2 monomers into filaments is controlled by normal levels of S100A4, assembly, and disassembly processes are symbolized by the double-headed arrow. d Experimentally increased levels of S100A4 lead to the sequestration of NM2 monomers and shifting towards the disassembly of filaments, assumed to result in a shift towards reduced cortical actomyosin tension and reduced multicellular compaction. Definitions of symbols are shown in the central text box.
|