|
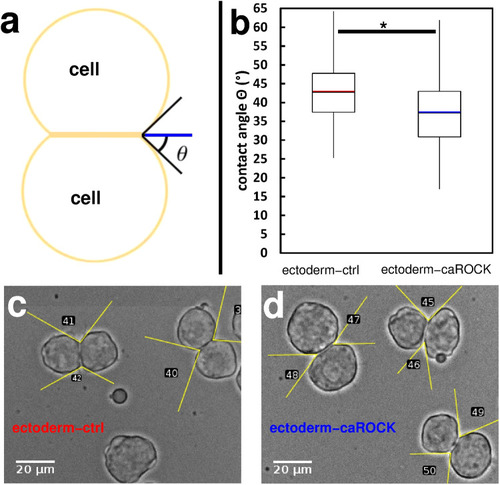
Contact formation is influenced by the regulation of actomyosin contractility. a Schematic image of a homotypic cell doublet after contact formation. Contact angle Θ is indicated by lines as a guide to the eye. b Quantitative analysis of contact angles of homotypic doublets of untreated ectoderm cells (ectoderm-ctrl, n = 170) or ectoderm cells overexpressing constitutively active ROCK (ectoderm-caROCK, n = 210). Contact angles were measured after 30 min of contact formation. Median values are highlighted by red and blue lines, asterisk (*) indicates a statistically significant difference with Student’s t-test, p < 0.001. c, d Representative phase-contrast images of freely adhering homotypic cell doublets in ectoderm-ctrl (c) or ectoderm-caROCK (d) suspensions after 30 min. Note the difference between (c) and (d) in contact angles highlighted by yellow lines as a guide to the eye. Numbers are contact angle IDs for analysis. Scale bar: 20 µm.
|