|
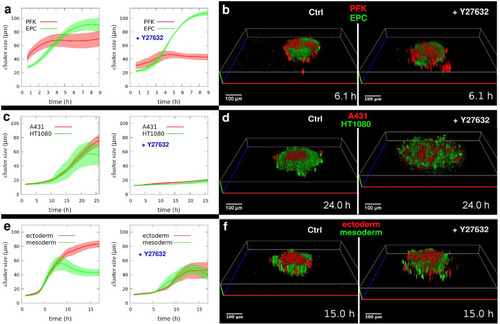
3D segregation dynamics depends on actomyosin contractility. Quantitative analysis of segregating homotypic cell domain sizes. a Time-dependent growth of segregated cell domains in mixed suspensions of PKF and EPC keratinocytes untreated (left panel, n = 7) or treated with 100 µM Y27632 ROCK inhibitor (right panel, n = 4). b Representative 3D reconstruction images from time-lapse videos of segregating clusters of PFK (red) and EPC (green) keratinocytes after 6 h segregation in the absence (left panel) or presence (right panel) of ROCK inhibitor, see Supplementary Movie 6. c Analysis of segregated cell cluster sizes in A431 keratinocyte and HT1080 fibrosarcoma mixtures without (left, n = 6) or with 50 µM Y27632 inhibitor (right, n = 6). d Representative images of A431 (red) and HT1080 (green) segregation in the absence (left) or presence (right) of inhibitor after 24 h segregation, see Supplementary Movie 7. e Analysis of segregated clusters in zebrafish ectoderm and mesoderm mixtures without (left, n = 8) or with 100 µM Y27632 (right, n = 6). f Representative images of ectoderm (red) and mesoderm (green) segregation in the absence (left) or presence (right) of inhibitor after 15 h segregation, see Supplementary Movie 8. Error stripes represent SEM in (a, c, e). Time after the initial mixing of heterotypic cell suspensions is indicated at lower right corners in (b, d, f), scale bars: 100 µm. Also see Supplementary Fig. 1.
|