IMAGE

Fig. 4

ID
ZDB-IMAGE-230814-103
Source
Figures for Méhes et al., 2023
Image
Figure Caption

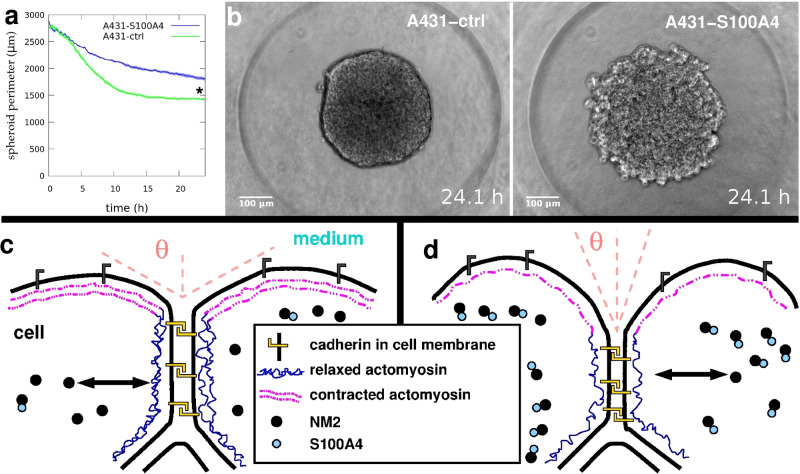
Fig. 4 Aggregation dynamics depend on non-muscle myosin 2 assembly.

Quantitative analysis of aggregation of A431 cells. a Time-dependent decrease in the mean perimeter of spheroids aggregating from homotypic cell suspension of A431 cells overexpressing either NM2 assembly inhibitor S100A4 (A431-S100A4, n = 10) or its inactive mutant isoform (A431-ctrl, n = 10). Error stripes represent SEM, asterisk (*) at t = 24 h indicates a statistically significant difference with Student’s t-test, p < 0.01. b Representative phase-contrast images from time-lapse videos of spheroids of A431-ctrl cells (left panel) or A431-S100A4 cells (right panel) after 24 h aggregation from suspension. Note the difference in spheroid surface roughness. Scale bar: 100 µm. Also see Supplementary Movie 9 and Supplementary Fig. 3. c, d Schematic representations of surface cells highlighting the cytoskeletal components involved in cortical tension generation. c Normal cells with effective multicellular compaction characterized by large contact angle Θ due to the contracted actomyosin network at the cell-medium surface and relaxed actomyosin at the cell-cell interface coupled by cadherins. Assembly of NM2 monomers into filaments is controlled by normal levels of S100A4, assembly, and disassembly processes are symbolized by the double-headed arrow. d Experimentally increased levels of S100A4 lead to the sequestration of NM2 monomers and shifting towards the disassembly of filaments, assumed to result in a shift towards reduced cortical actomyosin tension and reduced multicellular compaction. Definitions of symbols are shown in the central text box.

Acknowledgments
This image is the copyrighted work of the attributed author or publisher, and ZFIN has permission only to display this image to its users. Additional permissions should be obtained from the applicable author or publisher of the image. Full text @ Commun Biol