
Figure 5
- ID
- ZDB-FIG-230727-5
- Publication
- Cai et al., 2023 - Spatiotemporal visual statistics of aquatic environments in the natural habitats of zebrafish
- Other Figures
- All Figure Page
- Back to All Figure Page
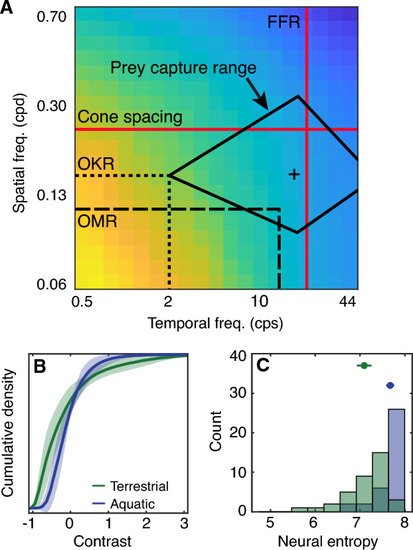
Implications for understanding visually guided behavior and neural coding. (A) The colormap shows the spatiotemporal power spectrum of the aquatic samples, reproduced from Fig. 4F using the same color scale. The horizontal dotted and dashed lines represent the spatial limit (visual acuity) of the optokinetic response (OKR) in larvae (0.16 cpd)21 and the optomotor response (OMR) in larvae (0.11 cpd, see our estimation based on22 in the methods section), respectively. The vertical dotted and dashed lines represent the approximate temporal limit of the OKR (~ 2 cps depending on stimulus velocity20) and the OMR (~ 14 cps18,19), respectively. Note that the temporal limit depends on the tested spatial frequencies and velocities. The solid black lines indicate the spatial and temporal stimulus bounds for larval prey capture (spatial: 0.09 to 0.33 cpd; temporal: 2 cps to 60 cps) and the cross indicates the "ideal" prey stimulus25. The red lines indicate the flicker fusion rate (FFR; 20 Hz)26,27 and the theoretical cone spacing limit (0.24 cpd) for larvae21. (B) Cumulative probability distributions for visual contrast are shown to illustrate different optimal neural response nonlinearities as described in32. (C) We applied each of the nonlinearities from (B) to the aquatic imagery in our dataset and computed the entropy of the predicted neural responses. |