
Figure 2
- ID
- ZDB-FIG-230727-2
- Publication
- Cai et al., 2023 - Spatiotemporal visual statistics of aquatic environments in the natural habitats of zebrafish
- Other Figures
- All Figure Page
- Back to All Figure Page
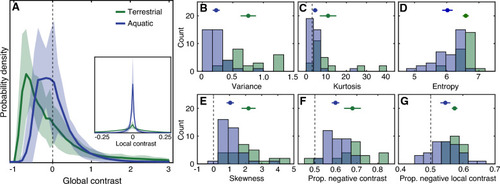
Contrast distributions differed between the terrestrial and aquatic samples. (A) Solid lines show the mean probability density of global contrast in terrestrial (green) and aquatic (blue) samples. The shaded area indicates the region plus or minus one standard deviation of the mean. (B–G) Statistics of the contrast distributions for each environment are plotted as histograms, including the variance (B), kurtosis (C), entropy (D), skewness (E), proportion negative global contrast (F) and proportion negative local contrast based on the difference of Gaussians contrast operator (G). Symbols above indicate the mean and standard deviation. Dashed lines indicate kurtosis = 3 (Gaussian), skewness = 0 (symmetric) and proportion negative contrast = 0.5. The inset in panel (A) shows the distribution of local contrast, which is much broader for the terrestrial samples. Note that the mean global contrast is always effectively zero because contrast is defined relative to the mean intensity of each sample, and is thus not included in the plots. |