
Figure 4
- ID
- ZDB-FIG-230727-4
- Publication
- Cai et al., 2023 - Spatiotemporal visual statistics of aquatic environments in the natural habitats of zebrafish
- Other Figures
- All Figure Page
- Back to All Figure Page
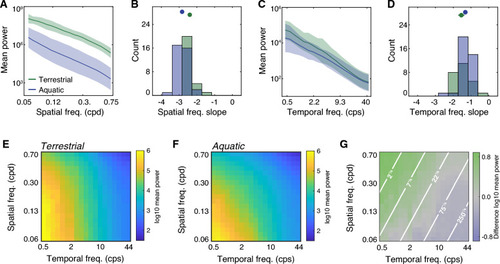
Spatiotemporal power spectra indicate more fast speeds in the aquatic samples. (A) Spatial power spectra. Lines indicate the mean log power across samples and shaded regions indicate plus or minus one standard deviation. Green and blue colors indicate terrestrial and aquatic samples, respectively. Cpd denotes cycles/degree. (B) Histograms of the best fit slopes of spatial power spectra in (A). The markers and errorbars show the means and the 95% confidence intervals. (C) Temporal power spectra, plotted in the same manner as (A). Cps denotes cycles/second. (D) Histograms of the best fit slope of temporal power spectra in (C). (E) The median terrestrial spatiotemporal power spectrum. (F) The median aquatic spatiotemporal power spectrum. (G) The difference between logarithmic values in (E) and (F). Lines illustrate iso-speed contours derived from the ratio of temporal frequency and spatial frequency. |