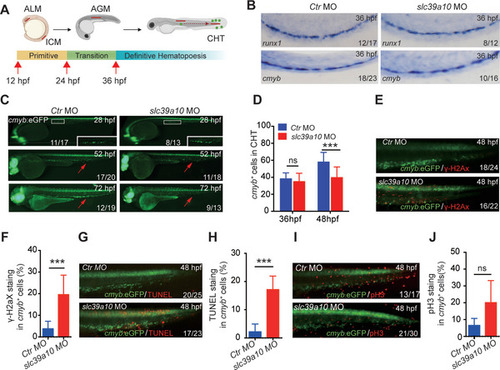
Loss of slc39a10 reduces the number of HSPCs in zebrafish via increased cell death. A) Developmental timeline showing the sites of hematopoiesis in zebrafish. The primitive wave begins at 12 hpf in two locations, the anterior lateral mesoderm (ALM) and the intermediate cellular mass (ICM), generating the majority of monocytes and erythrocytes before 24 hpf. In the definitive wave, which begins at 36 hpf, HSPCs arise from the AGM region and then migrate to the CHT region, where they undergo transitional proliferation and differentiation. The red lines indicate the shifting sites of hematopoiesis, and the green dots indicate HSPCs. B) Representative brightfield images of the AGM region, showing WISH of runx1 and cmyb in 36 hpf embryos injected with the control MO or the slc39a10 MO. C,D) Example fluorescence images of 28, 52, and 72 hpf Tg(cmyb:eGFP) embryos injected with the control MO or slc39a10 MO (C), and quantification of cmyb+ cells in the CHT measured at 36dpf and 48 hpf (D; n = 26 for control and n = 29 for slc39a10 morphants at 36 hpf, n = 35 for control and n = 40 for slc39a10 morphants at 48 hpf). E,F) Representative images (E) and quantification (F) of γ‐H2aX immunostaining in the CHT region of 48 hpf Tg(cmyb:eGFP) embryos injected with the control MO or slc39a10 MO (n = 10 each). G,H) Representative images (G) and quantification (H) of TUNEL immunostaining in the CHT region of 48 hpf Tg(cmyb:eGFP) embryos injected with the control MO or slc39a10 MO (n = 18 for control and n = 21 for slc39a10 morphants). I,J) Representative images (I) and quantification (J) of pH3 immunostaining in the CHT region of 48 hpf Tg(cmyb:eGFP) embryos injected with the control MO or slc39a10 MO (n = 13 for control and n = 21 for slc39a10 morphants). Data in (D), (F), (H), and (J) are presented as mean ± SD. p values in (D), (F), (H), and (J) using 2‐tailed unpaired Student's t‐test. ***p < 0.001 and ns, not significant.
|
