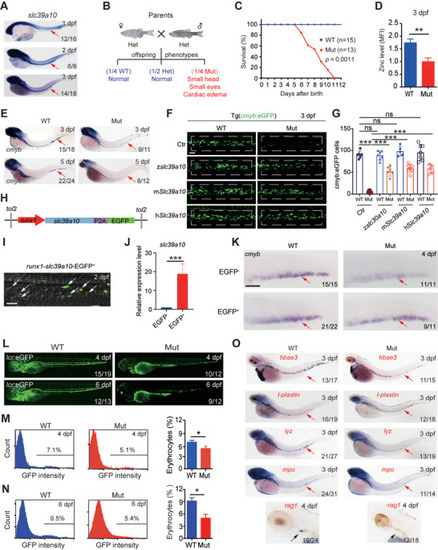
Slc39a10 mutant zebrafish have defective hematopoiesis. A) WISH of slc39a10 in WT embryos at the indicated stages. The arrows indicate a concentrated expression of slc39a10 in the hematopoietic region. B) Mating strategy for producing offspring from slc39a10 heterozygous crosses. The offspring were born at the expected Mendelian ratio. Note that the homozygous slc39a10 mutant embryos have a small head, small eyes, and cardiac edema. C) Kaplan–Meier survival curve of WT and slc39a10 mutant sibling (n = 15 and 13 embryos, respectively). D) Summary of zinc concentration measured in 3dpf WT and slc39a10 mutant sibling embryos loaded with the fluorescent zinc probe FluoZin‐3, AM (n = 3 per group). E) WISH of cmyb in WT and slc39a10 mutant siblings at the indicated stages. The arrows indicate the CHT region. F,G) Representative images of WT and Tg(cmyb:eGFP) slc39a10 mutant sibling embryos either uninjected or injected with slc39a10 mRNA of zebrafish, mouse, and human gene orthologs (F), and quantification of cmyb+ cells in the CHT region at 3dpf (G). The dashed boxes indicated the region of HSPC counting. Scale bar, 50 µm. H) Schematic illustration of the construct of full‐length slc39a10 driven by the runx1 enhancer. I) Confocal imaging showing the expression of Slc39a10 protein indicated by the green fluorescence (GFP) in runx1+ HSPCs in the CHT region at 2 dpf. The white arrows indicated runx1+ HSPC in the CHT. Scale bar, 50 µm. J) qPCR showing the mRNA level of slc39a10 in EGFP− and EGFP+ embryos at 4 dpf (n = 3 per group). K) WISH showing that the decreased expression of cmyb in slc39a10 mutant embryos was partially rescued by overexpression of slc39a10 in runx1+HSPCs. The red arrows indicate cmyb+ HSPCs in the CHT. Scale bar, 50 µm. L) Representative images of WT and slc39a10 mutant sibling embryos in Tg(globinLCR:GFP) background at the indicated stages. M,N) Example FACS analysis plots of GFP fluorescence measured in erythrocytes obtained from WT and slc39a10 mutant sibling embryos at the indicated stages and summary of the percentage of GFP+ erythrocytes (n = 4 per group). O) WISH of hbae3, l‐plastin, lyz, mpo, and rag1 mRNA in WT and slc39a10 mutant sibling embryos at the indicated stages. The red arrows indicate HSPCs in the CHT, and the black arrowheads indicate T cells in the thymus. Data in (D), (G), (J), (M), and (N) as mean ± SD. p values of survival in (C) were determined using the Log‐rank test, in (D), (G), (J), (M), and (N) using 2‐tailed unpaired Student's t‐test. *p < 0.05, **p < 0.01, ***p < 0.001, and ns, not significant.
|
