
Fig. 1
- ID
- ZDB-FIG-230612-7
- Publication
- Hodorovich et al., 2023 - Morphological and sensorimotor phenotypes in a zebrafish CHARGE syndrome model are domain-dependent
- Other Figures
- All Figure Page
- Back to All Figure Page
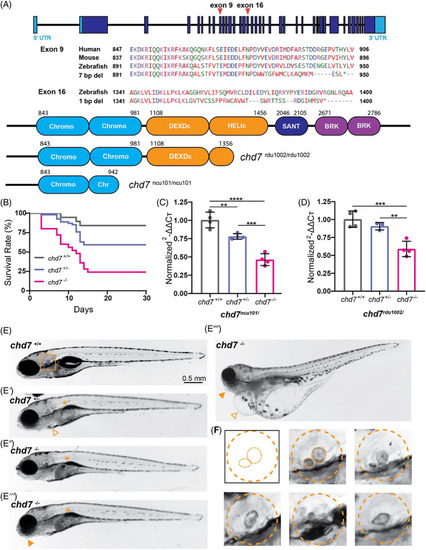
CRISPR/Cas9 generated chd7 mutants recapitulate CHARGE syndrome related phenotypes. (A) Exon‐intron structure of zebrafish chd7 with CRISPR exon 9 and exon 16 targeted regions noted; amino acid alignment and conservation of Exon 9, 2nd chromodomain target across species, identified 7 bp deletion from mutagenesis; amino acid alignment of Exon 16, ATP‐helicase domain target, and identified 1 bp deletion from mutagenesis; predicted Chd7 protein domains in wild‐type (top), ATP‐helicase domain 1 bp deletion allele (chd7 rdu1002/rdu1002 ), and chromodomain 7 bp deletion allele (chd7 ncu101/ncu101 ), additional target regions from sgRNAs noted. (B) Survival rate (%) of chd7 +/+ (n = 19), chd7 ncu101/+ (n = 54), and chd7 ncu101/ncu101 (n = 25) siblings during a 30‐day period. (C) qPCR analysis of chd7 mRNA in 5 dpf larvae (chd7 ncu101/, chromodomain allele), normalized to wild‐type siblings. Each point represents a biological replicate of pooled larvae (per pool, chd7 +/+ n ~ 12–13; chd7 ncu101/+ n ~ 20–21; chd7 ncu101/ncu101 n ~ 13–14). (D) qPCR analysis of chd7 mRNA in 5 dpf larvae (chd7 rdu1002/, ATP‐helicase domain allele), normalized to wild‐type siblings. Each point represents a biological replicate of pooled larvae (per pool, chd7 +/+ n ~ 13–14; chd7 rdu1002/− n ~ 22–23; chd7 rdu1002/rdu1002 n ~ 11–12) (mean ± SD, Ordinary one‐way ANOVA with Tukey's multiple comparisons, *p < 0.05, **p < 0.01, ***p < 0.001,****p < 0.0001). (E) Bright‐field images of 5 dpf larvae (chd7 +/+, chd7 ncu101/+, chd7 ncu101/ncu101 ) with examples of morphological phenotypes including uninflated swim bladder (asterisk), pericardial edema (triangle), and craniofacial defects (solid triangle). (F) Examples of varying otolith defects in chd7 ncu101/, dashed orange lines represent morphology of the otic vesicle, and anterior and posterior otoliths. |
| Fish: | |
|---|---|
| Observed In: | |
| Stage Range: | Day 5 to Days 30-44 |