
- Title
-
Morphological and sensorimotor phenotypes in a zebrafish CHARGE syndrome model are domain-dependent
- Authors
- Hodorovich, D.R., Lindsley, P.M., Berry, A.A., Burton, D.F., Marsden, K.C.
- Source
- Full text @ Genes Brain Behav.
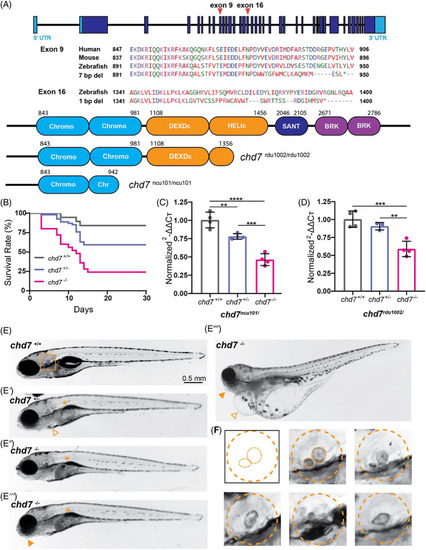
CRISPR/Cas9 generated chd7 mutants recapitulate CHARGE syndrome related phenotypes. (A) Exon‐intron structure of zebrafish chd7 with CRISPR exon 9 and exon 16 targeted regions noted; amino acid alignment and conservation of Exon 9, 2nd chromodomain target across species, identified 7 bp deletion from mutagenesis; amino acid alignment of Exon 16, ATP‐helicase domain target, and identified 1 bp deletion from mutagenesis; predicted Chd7 protein domains in wild‐type (top), ATP‐helicase domain 1 bp deletion allele (chd7 rdu1002/rdu1002 ), and chromodomain 7 bp deletion allele (chd7 ncu101/ncu101 ), additional target regions from sgRNAs noted. (B) Survival rate (%) of chd7 +/+ (n = 19), chd7 ncu101/+ (n = 54), and chd7 ncu101/ncu101 (n = 25) siblings during a 30‐day period. (C) qPCR analysis of chd7 mRNA in 5 dpf larvae (chd7 ncu101/, chromodomain allele), normalized to wild‐type siblings. Each point represents a biological replicate of pooled larvae (per pool, chd7 +/+ n ~ 12–13; chd7 ncu101/+ n ~ 20–21; chd7 ncu101/ncu101 n ~ 13–14). (D) qPCR analysis of chd7 mRNA in 5 dpf larvae (chd7 rdu1002/, ATP‐helicase domain allele), normalized to wild‐type siblings. Each point represents a biological replicate of pooled larvae (per pool, chd7 +/+ n ~ 13–14; chd7 rdu1002/− n ~ 22–23; chd7 rdu1002/rdu1002 n ~ 11–12) (mean ± SD, Ordinary one‐way ANOVA with Tukey's multiple comparisons, *p < 0.05, **p < 0.01, ***p < 0.001,****p < 0.0001). (E) Bright‐field images of 5 dpf larvae (chd7 +/+, chd7 ncu101/+, chd7 ncu101/ncu101 ) with examples of morphological phenotypes including uninflated swim bladder (asterisk), pericardial edema (triangle), and craniofacial defects (solid triangle). (F) Examples of varying otolith defects in chd7 ncu101/, dashed orange lines represent morphology of the otic vesicle, and anterior and posterior otoliths. PHENOTYPE:
|
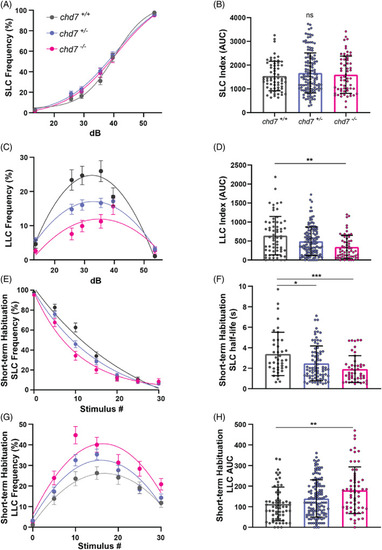
Loss of chd7 induces a context‐dependent LLC phenotype in auditory driven behaviors. (A) Acoustic startle responses, average short‐latency c‐bend (SLC) frequency as acoustic stimulus intensity increases (chd7 +/+ n = 64, chd7 ncu101/+ n = 127, chd7 ncu101/ncu101 n = 61) (mean ± SEM). (B) Short‐latency c‐bend sensitivity index, calculated by the area under the SLC frequency curves for individual larvae (mean ± SD, Ordinary one‐way ANOVA with Tukey's multiple comparison). (C) Long‐latency c‐bend (LLC) frequency as acoustic stimulus intensity increases (mean ± SEM). (D) Long‐latency c‐bend sensitivity index calculated by the area under the LLC frequency curves for individual larvae (mean ± SD, Kruskal‐Wallis with Dunn's multiple comparisons). (E) Short‐term habituation, average SLC frequency during 30 acoustic stimuli at highest intensity (chd7 +/+ n = 40, chd7 ncu101/+ n = 82, chd7 ncu101/ncu101 n = 47) (mean ± SEM). (F) SLC half‐life calculated by nonlinear regression (one‐phase exponential decay) of SLC frequency curves for individual larvae (mean ± SD, Kruskal‐Wallis with Dunn's multiple comparisons). (G) Average LLC frequency during 30 acoustic stimuli at highest intensity (mean ± SEM). (H) LLC sensitivity index calculated by the area under the LLC frequency curves for individual larvae (mean ± SD, Kruskal‐Wallis with Dunn's multiple comparisons, *p < 0.05, **p < 0.01, ***p < 0.001,****p < 0.0001). PHENOTYPE:
|
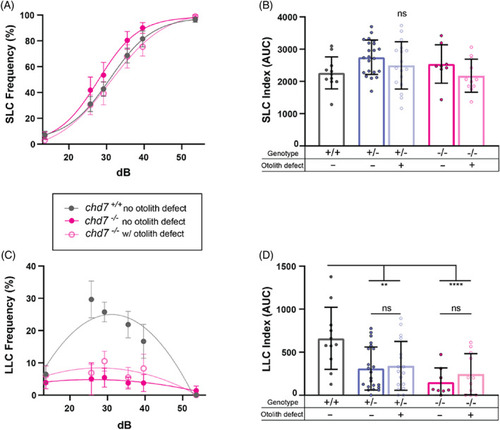
LLC deficit is independent of otolith morphology in chd7 chromodomain mutants. (A) Acoustic startle responses, average short‐latency c‐bend (SLC) frequency comparing chd7 ncu101/+ and chd7 ncu101/ncu101 with or without otolith defects (chd7 +/+ n = 11, chd7 ncu101/+ w/o otolith defect n = 22, chd7 ncu101/+ with otolith defect n = 17, chd7 ncu101/ncu101 w/o otolith defect n = 8, chd7 ncu101/ncu101 with otolith defect n = 11) (mean ± SEM). (B) Short‐latency c‐bend sensitivity index, calculated by the area under the SLC frequency curves for individual larvae (mean ± SD, Ordinary one‐way ANOVA with Tukey's multiple comparison). (C) Long‐latency c‐bend (LLC) frequency as acoustic stimulus intensity increases (mean ± SEM). (D) Long‐latency c‐bend sensitivity index calculated by the area under the LLC frequency curves for individual larvae (mean ± SD, Ordinary one‐way ANOVA with Tukey's multiple comparison, **p < 0.01, ****p < 0.0001). PHENOTYPE:
|
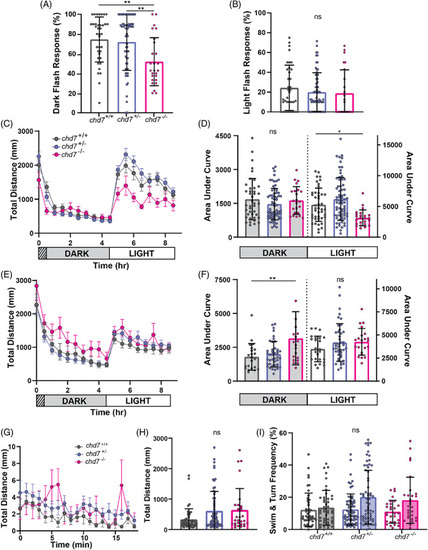
Hypo‐ and hyper‐activity phenotypes in chromodomain and ATP‐helicase domain mutants. (A) Chromodomain larval dark‐flash and (B) light‐flash response frequencies (chd7 +/+ n = 37, chd7 ncu101/+ n = 69, chd7 ncu101/ncu101 n = 26) (mean ± SD, Ordinary one‐way ANOVA with Tukey's multiple comparison, **p < 0.01). (C) Chromodomain larval average total distance traveled plot during 9 h of recording, analyzed every 30 min, including 1 h of acclimation in the dark, 4 h in the dark, and 4 h in light (chd7 +/+ n = 44, chd7 ncu101/+ n = 70, chd7 ncu101/ncu101 n = 26) (mean ± SEM). (D) Chromodomain larval area under the curve for individual distance plots during the dark or light phase (mean ± SD, Ordinary one‐way ANOVA with Dunnett's multiple comparisons, *p < 0.05). (E) ATP‐helicase domain larval average total distance traveled (chd7 +/+ n = 22, chd7 rdu1002/+ n = 42, chd7 rdu1002/rdu1002 n = 20) (mean ± SEM) and (F) area under the curve during the dark or light phase (mean ± SEM (G) chromodomain larval total distance time plot during 18.5 min of recording (chd7 +/+ n = 46, chd7 ncu101/+ n = 67, chd7 ncu101/ncu101 n = 29) (mean ± SEM). (H) Sum of total distance traveled for individual larvae, (I) swim (open bars) and turn (shaded bars) frequencies (mean ± SD, Kruskal‐Wallis with Dunn's multiple comparisons). PHENOTYPE:
|
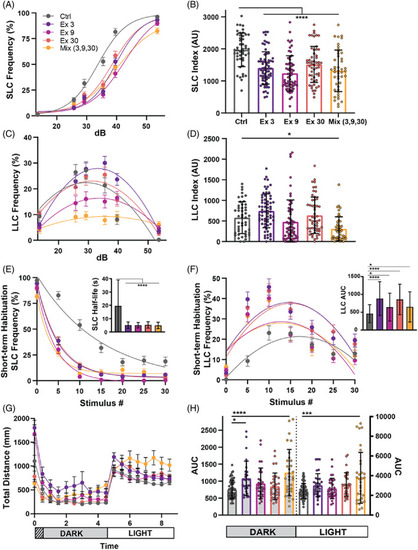
CRISPR guides targeting different chd7 Exons induce varying phenotypes. (A) Acoustic startle responses, average short‐latency c‐bend (SLC) frequency as acoustic stimulus intensity increases (Control n = 47, Exon 3 n = 66, Exon 9 n = 60, Exon 30 n = 54, Mix n = 45) (mean ± SEM). (B) Short‐latency c‐bend sensitivity index, calculated by the area under the SLC frequency curves for individual larvae (mean ± SD, Ordinary one‐way ANOVA with Dunnett's multiple comparisons). (C) Long‐latency c‐bend (LLC) frequency as acoustic stimulus intensity increases (mean ± SEM). (D) Long‐latency c‐bend sensitivity index calculated by the area under the LLC frequency curves for individual larvae (mean ± SD, Ordinary one‐way ANOVA with Dunnett's multiple comparisons). (E) Short‐term habituation, average SLC frequency (Control n = 48, Exon 3 n = 61, Exon 9 n = 59, Exon 30 n = 57, Mix n = 49) (mean ± SEM) during 30 acoustic stimuli at highest intensity with (inset) SLC half‐life calculated by nonlinear regression (one‐phase exponential decay) of SLC frequency curves for individual larvae (mean ± SD, Ordinary one‐way ANOVA with Dunnett's multiple comparisons). (F) Average LLC frequency (mean ± SEM) during 30 acoustic stimuli at highest intensity with (inset) LLC sensitivity index calculated by the area under the LLC frequency curves for individual larvae (mean ± SD, Ordinary one‐way ANOVA with Dunnett's multiple comparisons). (G) Average total distance traveled plot during 9 h of recording, analyzed every 30 min, including 1 h of acclimation, 4 h in the dark, and 4 h in light (Control n = 54, Exon 3 n = 27, Exon 9 n = 30, Exon 30 n = 31, Mix n = 31) (mean ± SEM). (H) Area under the curve for individual larvae distance plots during the dark or light phase (mean ± SD, Ordinary one‐way ANOVA with Dunnett's multiple comparisons, *p < 0.05, ***p < 0.001,****p < 0.000). |
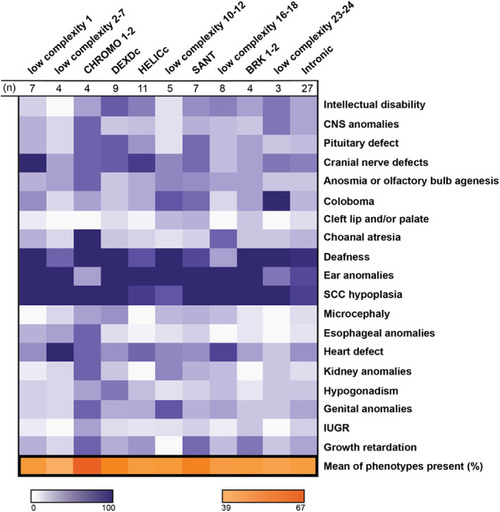
Correlation of mutation location and phenotype penetrance in a cohort of CHARGE patients. Heat map displaying the frequency of patients with a specified phenotype and a mutation within a particular CHD7 domain; domains were determined by amino acid alignments (n = 89, n = 30 patients excluded from the original pool of 119 participants because of insufficient information or mutation did not align to a domain). CHD7 domains are represented by columns and phenotypes are represented by rows. Frequencies were calculated by the number of patients with a reported phenotype and mutation in the respective domain over the total number of patients within the same domain (purples). Final row represents the overall average phenotype frequency for a specific domain (oranges). Patient data was obtained from the paper Phenotype and genotype analysis of a French cohort of 119 patients with CHARGE syndrome, Legendre et al. 16 Darker colors indicate a higher frequency, with ranges indicated in the legends. CNS, central nervous system; IUGR, intrauterine growth restriction; SCC, semicircular canal. |

ZFIN is incorporating published figure images and captions as part of an ongoing project. Figures from some publications have not yet been curated, or are not available for display because of copyright restrictions. |
|
ZFIN is incorporating published figure images and captions as part of an ongoing project. Figures from some publications have not yet been curated, or are not available for display because of copyright restrictions. |