
Fig. 4
- ID
- ZDB-FIG-230612-10
- Publication
- Hodorovich et al., 2023 - Morphological and sensorimotor phenotypes in a zebrafish CHARGE syndrome model are domain-dependent
- Other Figures
- All Figure Page
- Back to All Figure Page
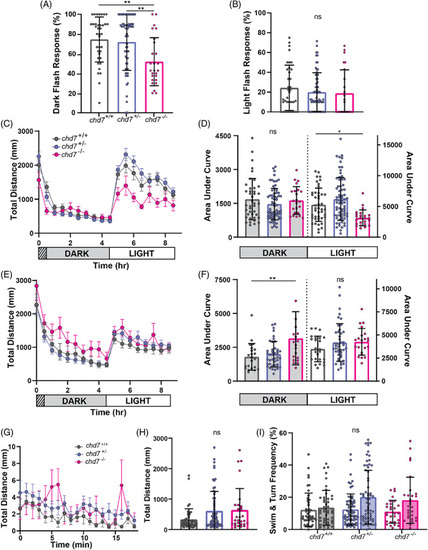
Hypo‐ and hyper‐activity phenotypes in chromodomain and ATP‐helicase domain mutants. (A) Chromodomain larval dark‐flash and (B) light‐flash response frequencies (chd7 +/+ n = 37, chd7 ncu101/+ n = 69, chd7 ncu101/ncu101 n = 26) (mean ± SD, Ordinary one‐way ANOVA with Tukey's multiple comparison, **p < 0.01). (C) Chromodomain larval average total distance traveled plot during 9 h of recording, analyzed every 30 min, including 1 h of acclimation in the dark, 4 h in the dark, and 4 h in light (chd7 +/+ n = 44, chd7 ncu101/+ n = 70, chd7 ncu101/ncu101 n = 26) (mean ± SEM). (D) Chromodomain larval area under the curve for individual distance plots during the dark or light phase (mean ± SD, Ordinary one‐way ANOVA with Dunnett's multiple comparisons, *p < 0.05). (E) ATP‐helicase domain larval average total distance traveled (chd7 +/+ n = 22, chd7 rdu1002/+ n = 42, chd7 rdu1002/rdu1002 n = 20) (mean ± SEM) and (F) area under the curve during the dark or light phase (mean ± SEM (G) chromodomain larval total distance time plot during 18.5 min of recording (chd7 +/+ n = 46, chd7 ncu101/+ n = 67, chd7 ncu101/ncu101 n = 29) (mean ± SEM). (H) Sum of total distance traveled for individual larvae, (I) swim (open bars) and turn (shaded bars) frequencies (mean ± SD, Kruskal‐Wallis with Dunn's multiple comparisons). |
| Fish: | |
|---|---|
| Condition: | |
| Observed In: | |
| Stage: | Day 5 |