
Figure 5—figure supplement 2.
- ID
- ZDB-FIG-230526-17
- Publication
- Letelier et al., 2023 - Mutation of vsx genes in zebrafish highlights the robustness of the retinal specification network
- Other Figures
-
- Figure 1—figure supplement 1.
- Figure 1—figure supplement 1.
- Figure 1—figure supplement 2.
- Figure 1—figure supplement 3.
- Figure 2—figure supplement 1.
- Figure 2—figure supplement 1.
- Figure 3—figure supplement 1.
- Figure 3—figure supplement 1.
- Figure 4—figure supplement 1.
- Figure 4—figure supplement 1.
- Figure 4—figure supplement 2.
- Figure 4—figure supplement 3.
- Figure 5—figure supplement 1.
- Figure 5—figure supplement 1.
- Figure 5—figure supplement 2.
- Figure 5—figure supplement 3.
- Figure 5—figure supplement 4.
- All Figure Page
- Back to All Figure Page
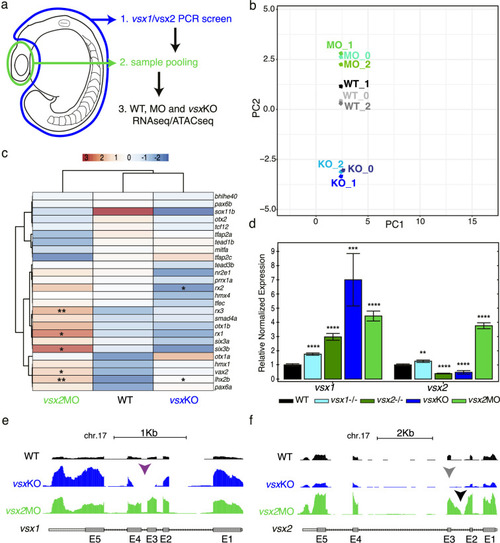
(a) Experimental design. Zebrafish heads including both eyes were mechanically dissected at 18hpf from WT, vsxKO and vsx2MO samples. The trunk and tail (highlighted in blue) were used to extract DNA and genotyping of WT and vsxKO embryos. After genotyping, samples from individual embryos previously dissected were pooled and used for ATAC-seq and/or RNA-seq protocols. (b). RNA-seq PCA evaluation revealing the transcriptomic divergence between WT (black/grey), vsxKO (blue) and vsx2MO (green) samples. (c). Heatmap chart showing gene expression differences between WT, vsxKO and vsx2MO samples of the main retinal transcriptional regulators (*p<0.05; p**<0.01). (d). vsx1 and vsx2 expression levels analysed by real time PCR (n=3) in WT, vsx1∆245, vsx2∆73, vsxKO, and vsx2MO samples. All statistical comparisons are relative to the WT animals using one-way ANOVA (**p<0.01; ***p<0.001; ****p<0.0001; no label = no significant differences). Data is shown as mean ± SD. (e). Graphical visualization of RNA-seq tracks showing vsx1 gene expression in WT, vsxKO, and vsx2MO eyes. In vsxKO samples (blue track), the deletion generated by CRISPR/Cas9 is noticeable due to the lack of reads in part of the third and fourth exons (purple arrowhead). (f). RNA-seq tracks showing vsx2 expression in WT, vsxKO, and vsx2MO samples. In vsxKO samples (blue track), the deletion is evident by the lack of reads in the third exon (grey arrowhead). In vsx2 morphants (green track), a retention of the second intron due to the action of the morpholino can be appreciated. |