
Figure 8
- ID
- ZDB-FIG-230427-27
- Publication
- McQuate et al., 2023 - Activity regulates a cell type-specific mitochondrial phenotype in zebrafish lateral line hair cells
- Other Figures
- All Figure Page
- Back to All Figure Page
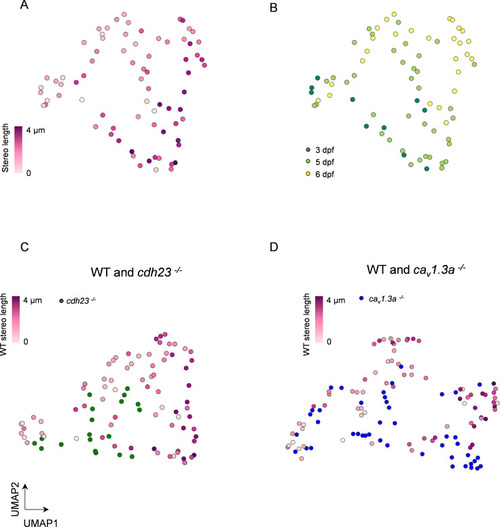
(A) UMAP plot of HCs based on principal component analysis of mitochondrial properties. Variables included in this analysis: (1) number of mitochondria, (2) total mitochondrial volume, (3) max mito volume, (4) max mito cable length, (5) median mito volume, (6) average minimum distance between max mito and ribbons, and (7) average minimum distance between median mito and ribbons. HCs are color-coded by stereocilia length. (B) Same UMAP analysis as in (A), color-coded according to age of the animal. Total HCs, n = 75. 3 days post fertilization (dpf) HC: n = 10, 2 NM, 2 fish. 5 dpf HCs: 38 HC, 3 NM, 2 fish. 6 dpf HC: n = 27 HC, 2 NM, 1 fish. (C) UMAP analysis comparing WT to cdh23 HCs. (D) UMAP plot comparing WT to cav1.3a HC. WT HC data, n = 75 HCs, 7 NM, 5 fish (3–6 dpf, same as A and B). cdh23 data, n = 19, 4 NM, 2 fish, 5 dpf. cav1.3a data, n = 45, 4 NM, 2 fish, 5 dpf.
|