
Figure 2
- ID
- ZDB-FIG-230427-12
- Publication
- McQuate et al., 2023 - Activity regulates a cell type-specific mitochondrial phenotype in zebrafish lateral line hair cells
- Other Figures
- All Figure Page
- Back to All Figure Page
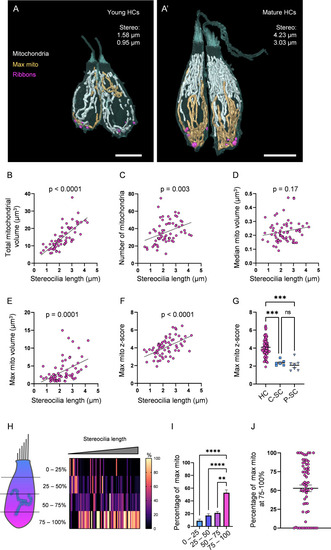
(A) Two young HCs from a 5 days post fertilization (dpf) neuromasts (NM) (NM1, Figure 2—source data 2). Mitochondria are shown in white. Single largest mitochondrion (max mito) is shown in gold. Synaptic ribbons shown in purple. Scale bar = 5 µm. (A’) Two mature HCs from a 5 dpf NM (NM3, different HCs than in Figure 1B). Scale bar = 6 µm. (B) Relationship between HC stereocilia length and the total mitochondrial volume. (C) Relationship between HC stereocilia length and the number of individual mitochondria. (D) Relationship between HC stereocilia length and the volume of the median mitochondrion. (E) Relationship between HC stereocilia length and the volume of the largest mitochondrion (max mito). (F) Relationship between HC stereocilia length and the number of standard deviations between the max mito and average mitochondrial volume (max mito z-score). Lines represent standard linear regression, with significance as indicated. (G) The z-score of the max mito in HCs, central supporting cells (C-SCs), and peripheral supporting cells (P-SCs) (mean ± SEM) HC: 4.1 ± 0.1; C-SC: 2.4 ± 0.1, P-SC: 2.1 ± 0.2. Kruskal–Wallis test with Dunn’s multiple comparisons, ***p<0.001. (H) The percentage of the max mito located within each quadrant of an HC represented as a heat map. The length of each HC was normalized and broken into quadrants, with the highest HC point the base of the stereocilia bundle and the lowest point the lowest ribbon. The number of max mito segmentation coordinates within each quadrant of an HC were counted and represented as a percentage of all max mito coordinates. Cells are presented in order of their stereocilia lengths. (I) Summary of heat map data shown in (H). Most apical quadrant (0–25%): 9 ± 2.4%; 25–50%: 17.1 ± 2.7%; 50–75%: 21 ± 2.2%; Most basal quadrant (75–100%): 52.8 ± 4.4%. Kruskal–Wallis test with Dunn’s multiple comparisons, **p<0.01, ****p<0.0001. (J) Percentage of the max mito located within the most basal quadrant for individual HCs. HC: n = 65, 5 NMs, 3 fish; C-SC: n = 6, 3 NMs, 2 fish; P-SC: n = 7, 3 NMs, 2 fish.
|